Submit an Article
Navigate
Home
Editorial Board
Editorial Policies
Current Volume
Archive
Scientific Integrity
Publication Ethics Statements
Interviews with Outstanding Authors
Newsroom
Sponsored Conferences
Podcast
Contact
Special Collections
Submit an Article
Online ISSN: 1945-4589
Research Paper
|
Volume 16, Issue 9
|
pp. 7845–7855
Left ventricular systolic dysfunction predicts clinical prognosis in patients with acute ischemic stroke after intravenous thrombolysis
Back to article
Figure 3
(3 of 4)
−
100%
+
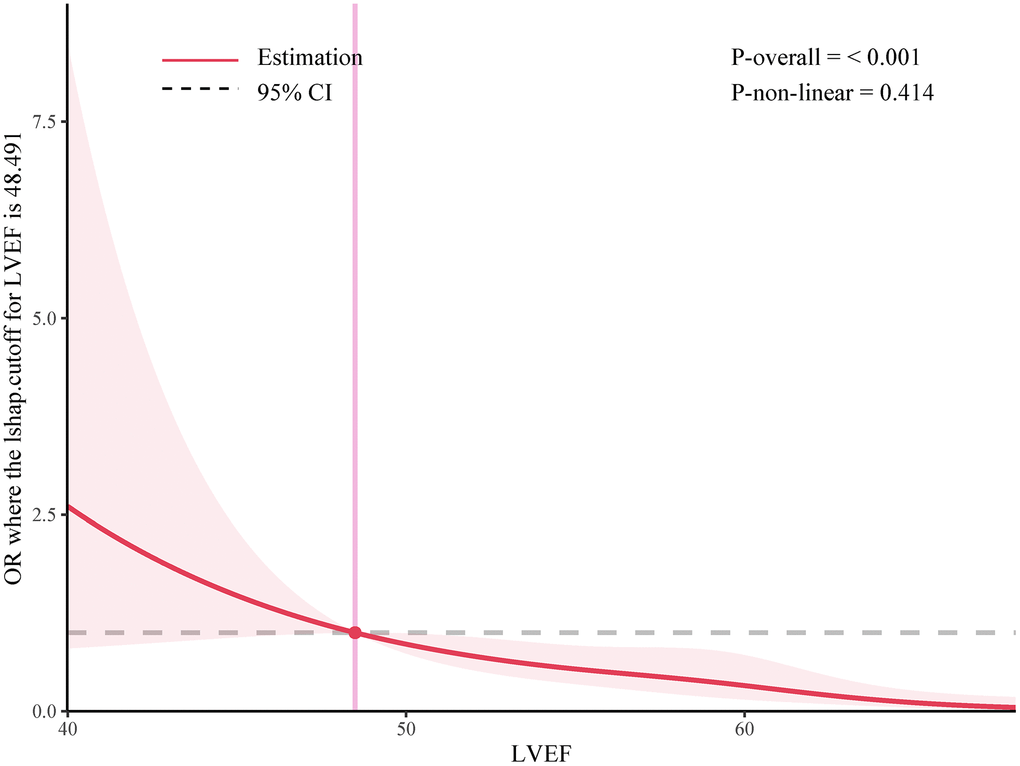
Figure 3.
Adjusted ORs of the 3-month primary outcome according to LVEF levels after IVT.
OR and 95% CI derived from restricted cubic spline regression, with knots placed at the 5th, 35th, 65th, and 95th percentiles of the levels of LVEF after IVT.