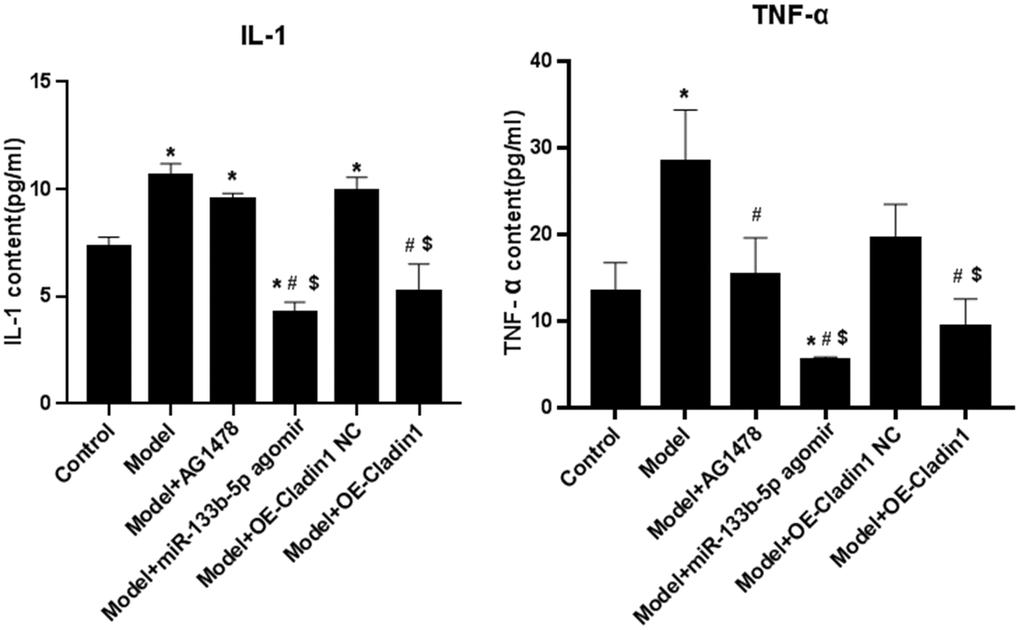
Figure 4.The content of inflammatory indicators IL-1 and TNF-α in the serum of rats in each group (*P<0.05, compared with the control group; #P<0.05, compared with the model group; $P<0.05, compared with the model + Claudin1 overexpression no-load group).