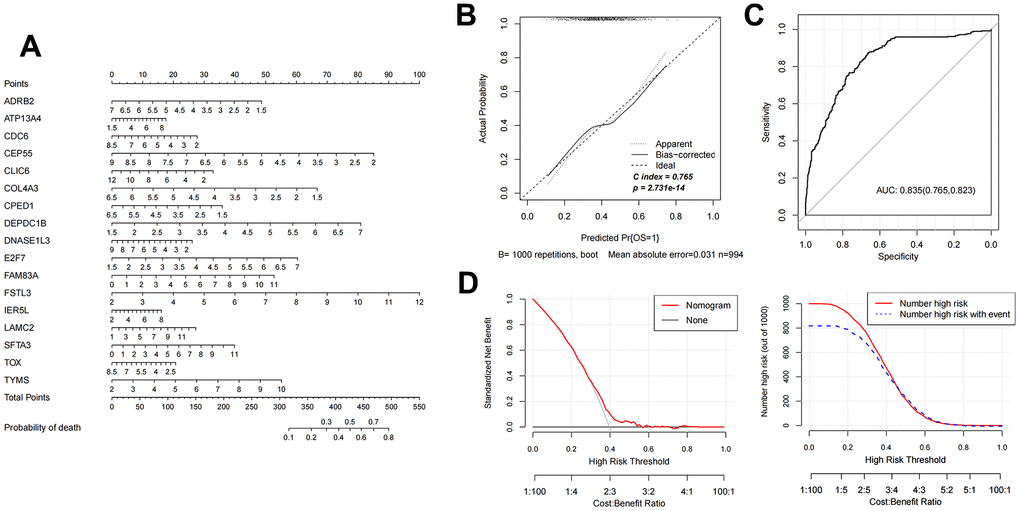
Figure 4.Nomogram diagnostic model construction and evaluation. (A) Nomogram model diagram based on the expression level of 17 characteristic mRNAs in the combined training data set. (B) Nomogram diagnostic model line chart. (C) The ROC value was calculated. (D) Model decision line diagram.