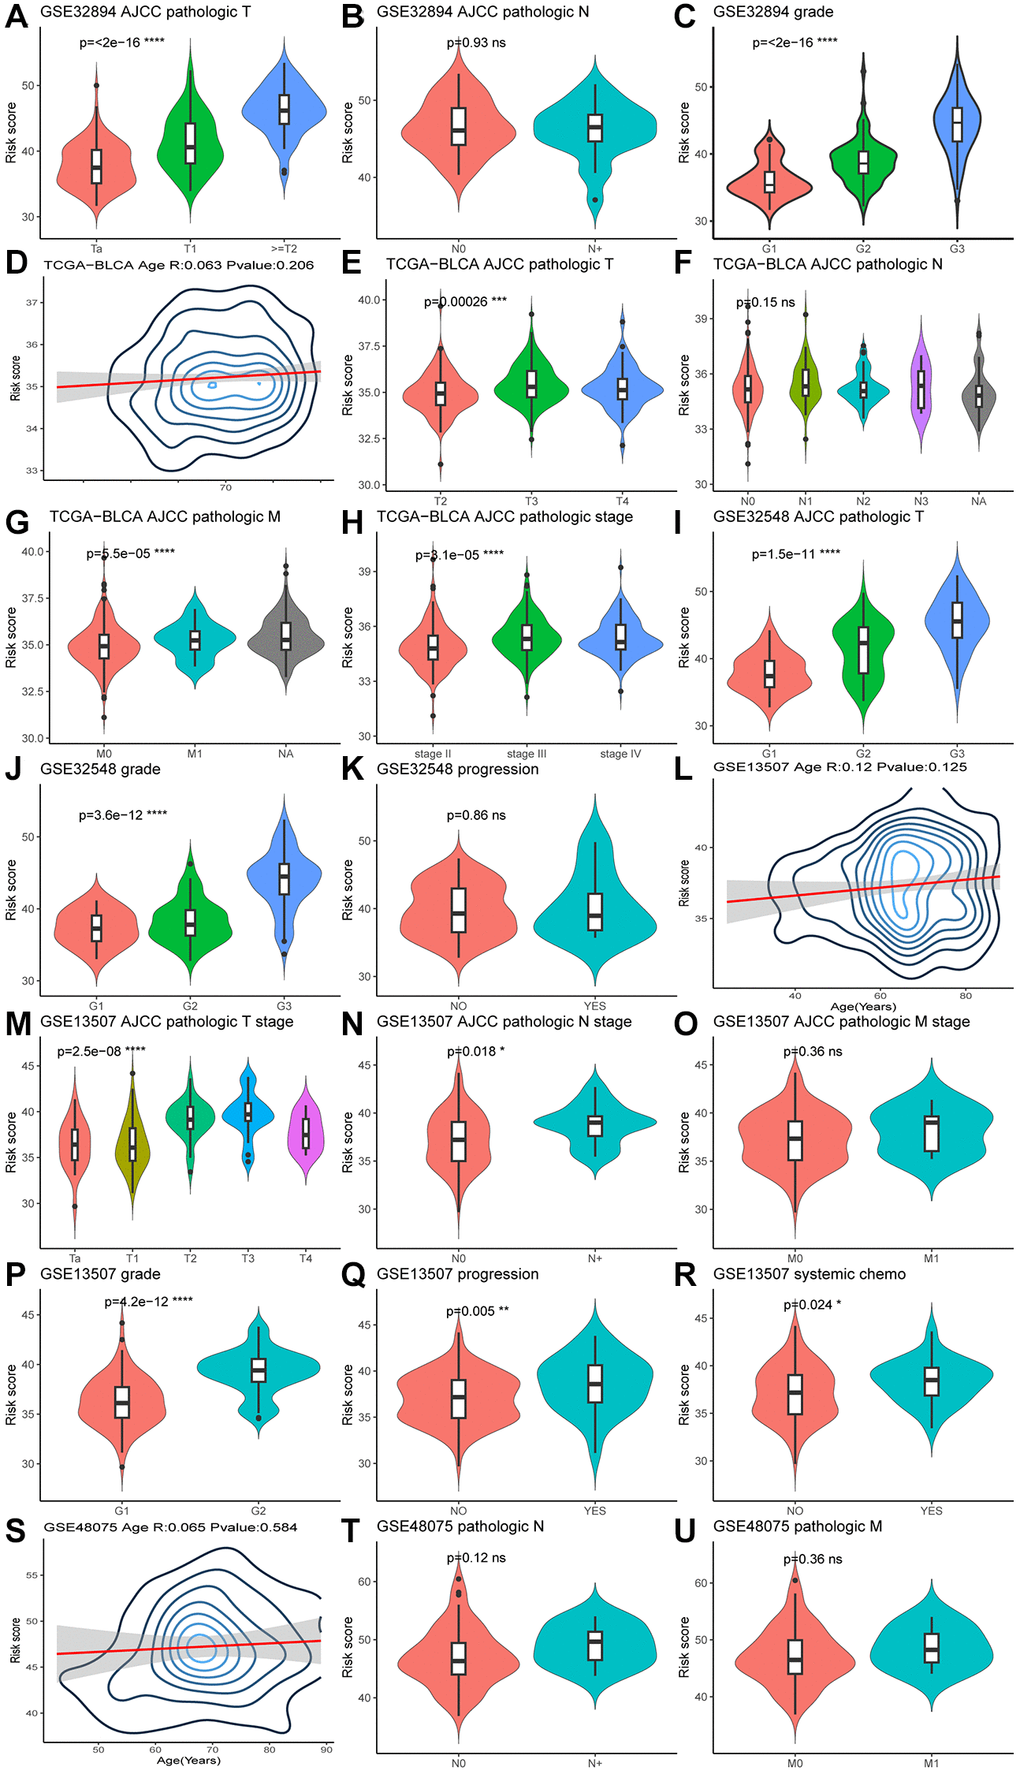
Figure 6.Violin plots (A–U) illustrate the relationship between clinical factors and risk scores, employing the Wilcoxon test for comparisons between two variables and the Kruskal-Wallis test for comparisons among more than two variables.
Figure 6 — The identification of a N6-methyladenosin-modifed immune pattern to predict immunotherapy response and survival in urothelial carcinoma | Aging