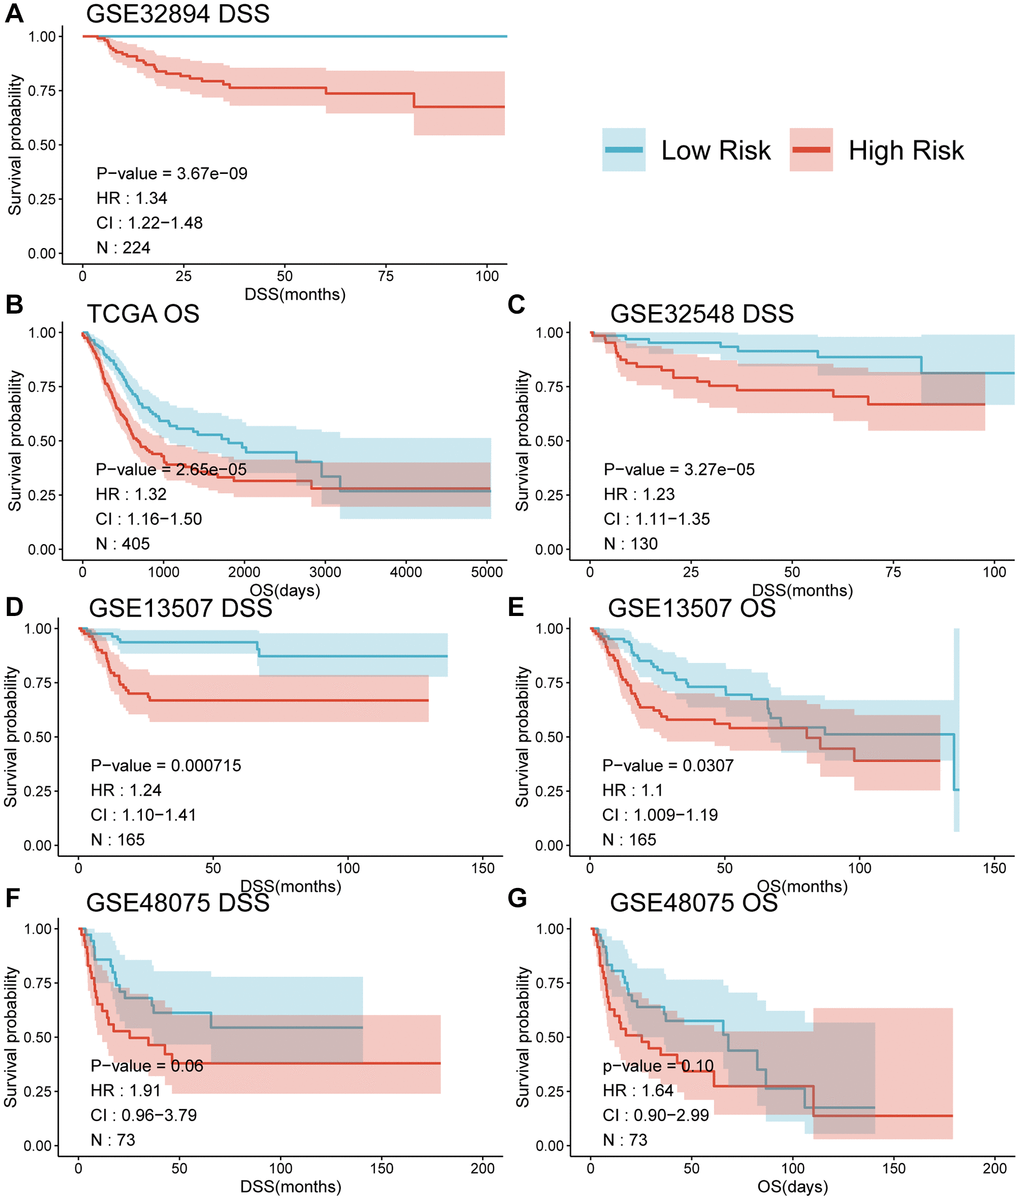
Figure 4.Survival curves (A–G) comparing the survival between different risk groups based on MPIGs across various datasets.
Figure 4 — The identification of a N6-methyladenosin-modifed immune pattern to predict immunotherapy response and survival in urothelial carcinoma | Aging