Submit an Article
Navigate
Home
Editorial Board
Editorial Policies
Current Volume
Archive
Scientific Integrity
Publication Ethics Statements
Interviews with Outstanding Authors
Newsroom
Sponsored Conferences
Podcast
Contact
Special Collections
Submit an Article
Online ISSN: 1945-4589
Research Paper
|
Volume 16, Issue 9
|
pp. 7733–7751
A real-world study was conducted to develop a nomogram that predicts the occurrence of anastomotic leakage in patients with esophageal cancer following esophagectomy
Back to article
Figure 4
(4 of 7)
−
100%
+
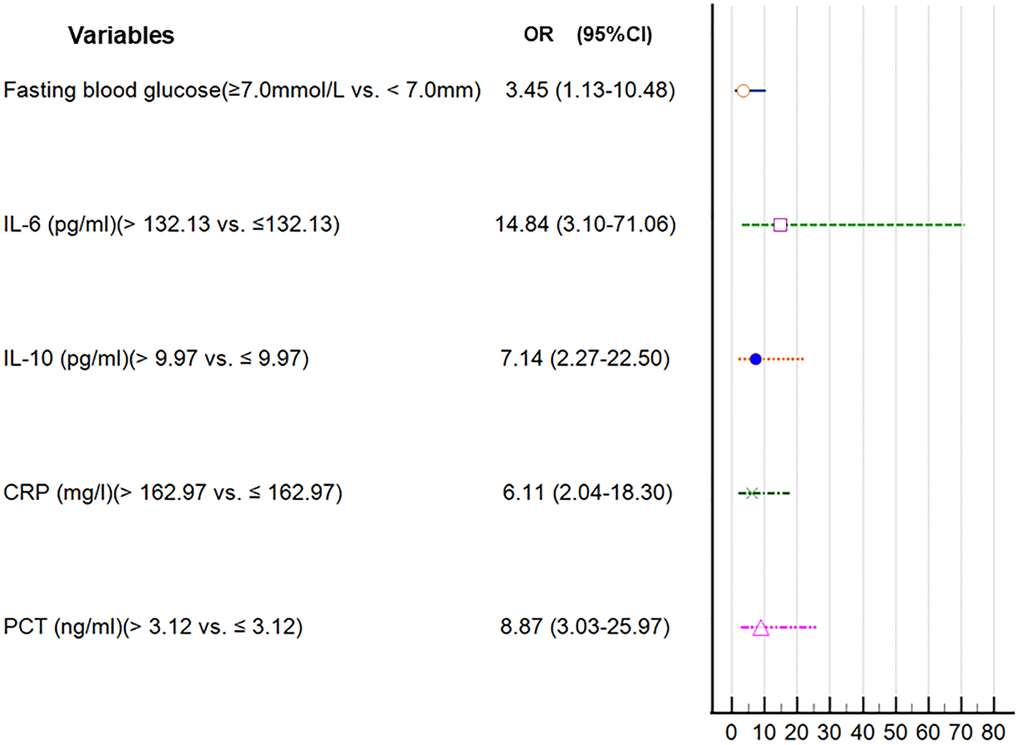
Figure 4.
Forest plot of the parameters in the multivariate regression analysis.