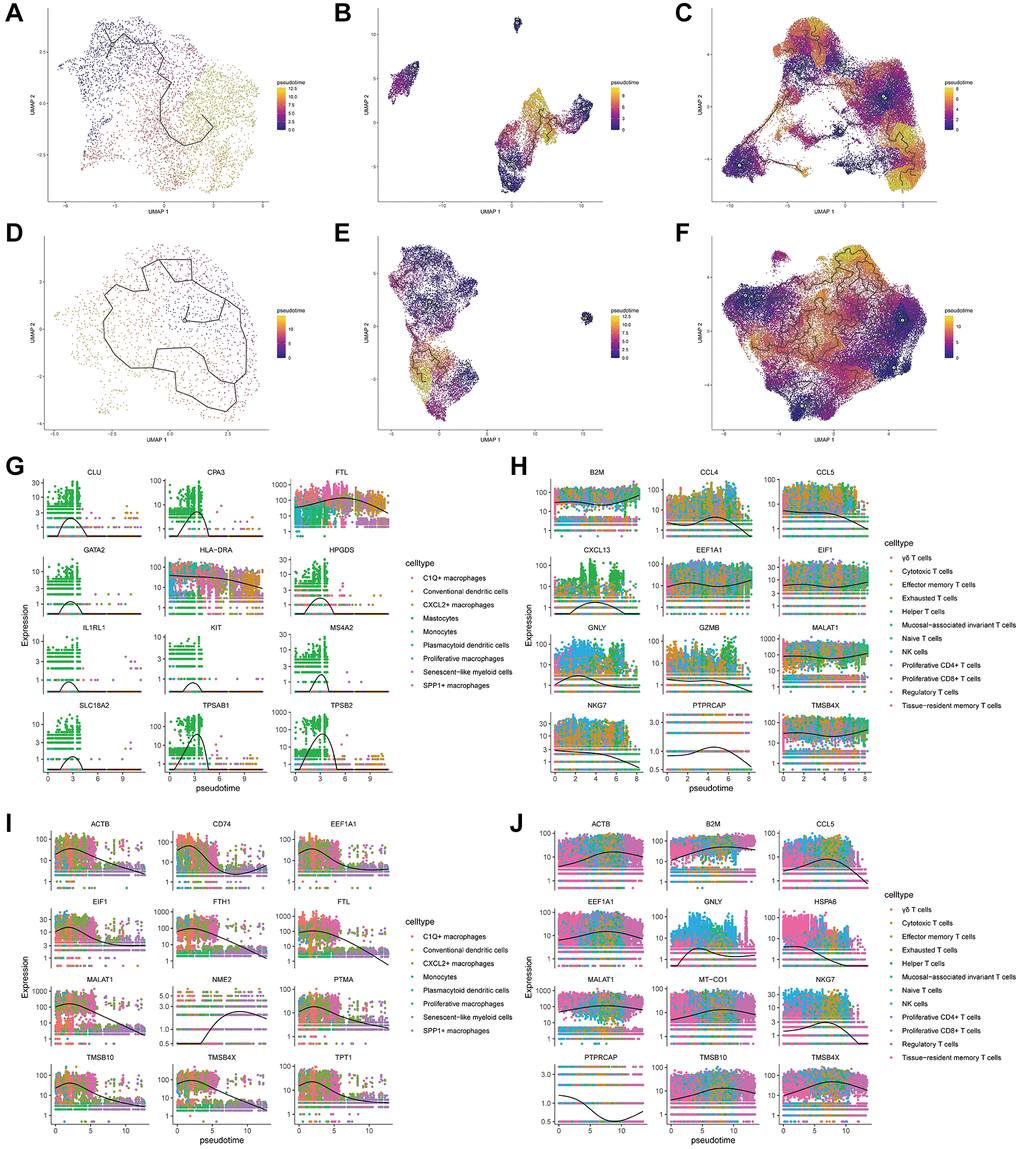
Figure 3.Results of cell differentiation trajectory inference based on monocle3. (A–C) Pseudotime cell differentiation trajectory plots for subtypes of epithelial cells (A), myeloid cells (B), and NK/T cells (C) in primary colorectal cancer tissues. (D–F) Pseudotime cell differentiation trajectory plots for subtypes of epithelial cells (D), myeloid cells (E), and NK/T cells (F) in liver metastasis colorectal cancer tissues. (G, H) Pseudotemporal expression trends of specific development-related genes in myeloid cells (G) and NK/T cells (H) in primary colorectal cancer tissues. (I, J) Pseudotemporal expression trends of particular development-related genes in myeloid cells (I) and NK/T cells (J) in liver metastasis colorectal cancer tissues.