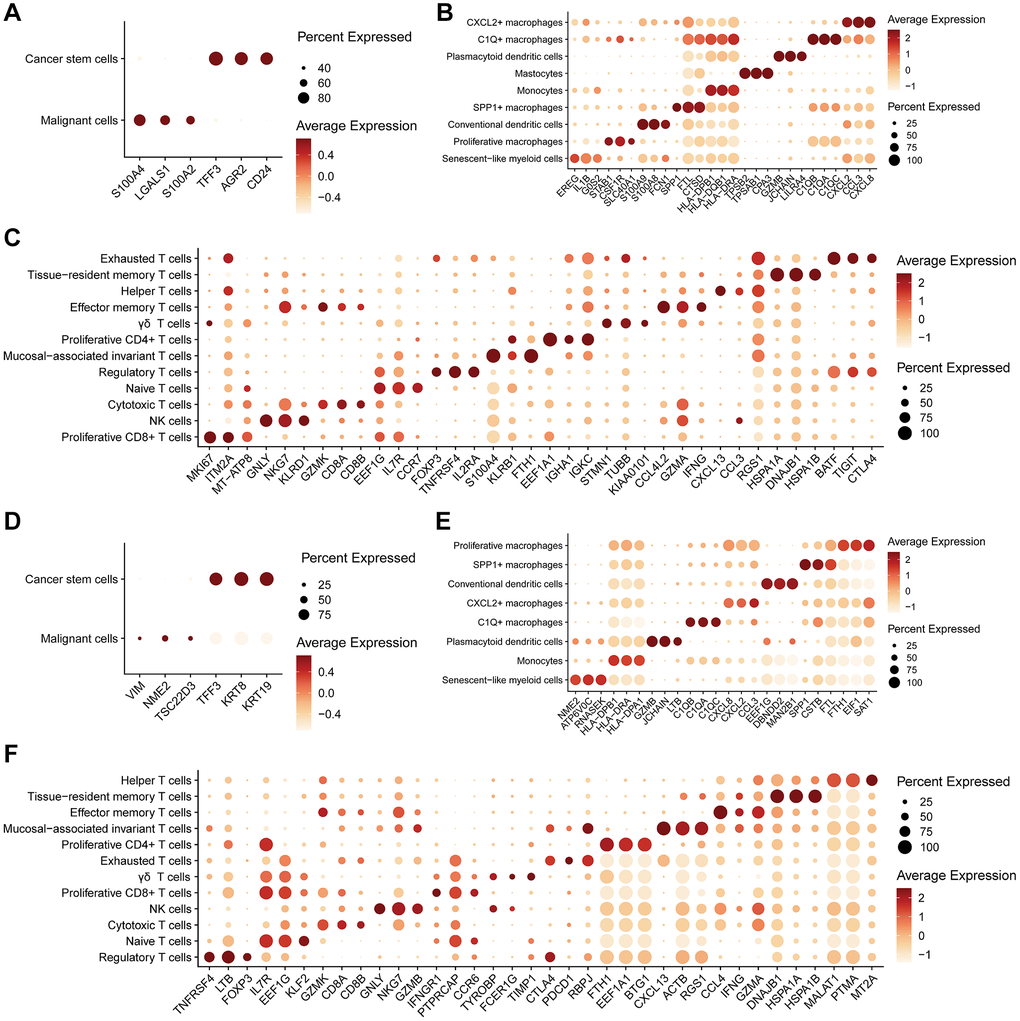
Figure 2.Expression levels of markers in different cell subtypes. (A–C) Bubble plots illustrate the expression levels of the top 3 markers in subtypes of epithelial cells (A), myeloid cells (B), and NK/T cells (C) in primary colorectal cancer tissues. (D–F) Bubble plots depict the expression levels of the top 3 markers in subtypes of epithelial cells (D), myeloid cells (E), and NK/T cells (F) in liver metastasis colorectal cancer tissues.