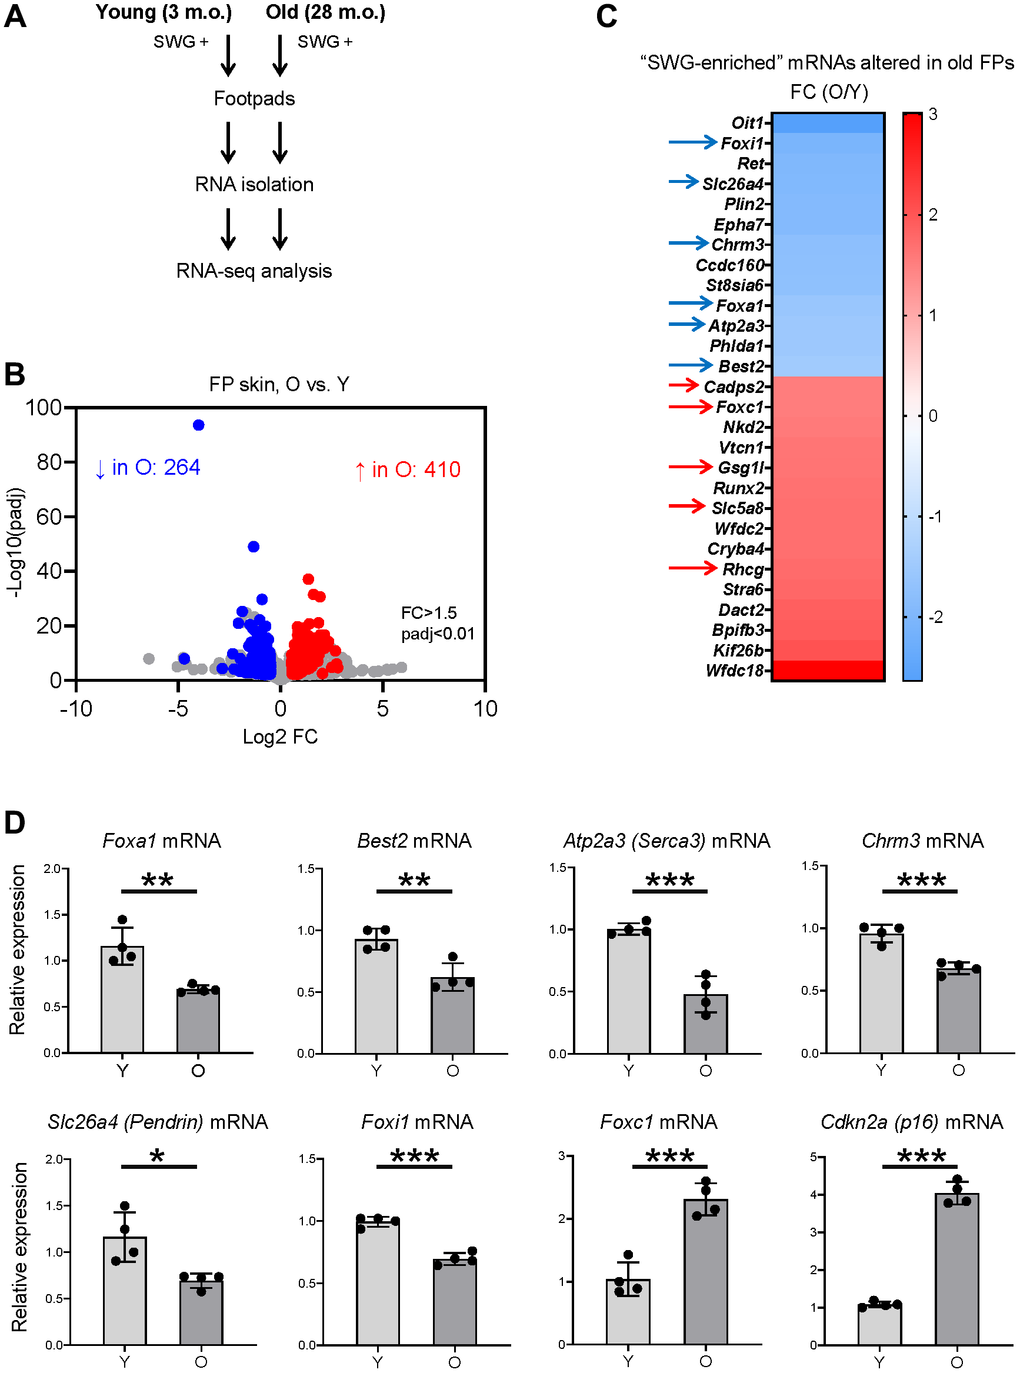
Figure 4.Identification of SWG mRNAs displaying altered expression in old footpad skin. (A) Schematic of the RNA-seq analysis. (B) Volcano plot of differentially expressed mRNAs in young (3 m.o.) versus old (28 m.o.) male footpad skin. (C) 28 SWG-enriched mRNAs showing differential abundance in old footpad skin; 11 core secretory mRNAs showing differential abundance in expression in old footpads (arrows). (D) RT-qPCR analysis of the expression levels of core secretory mRNAs and a senescent marker, p16 mRNA, in young (3 m.o.) and old (28 m.o.) male footpad skin. Data in (D) represent the means and S.D. from four biological replicates; significance (*p < 0.05; **p < 0.01; ***p < 0.001) was established using Student’s t-test.