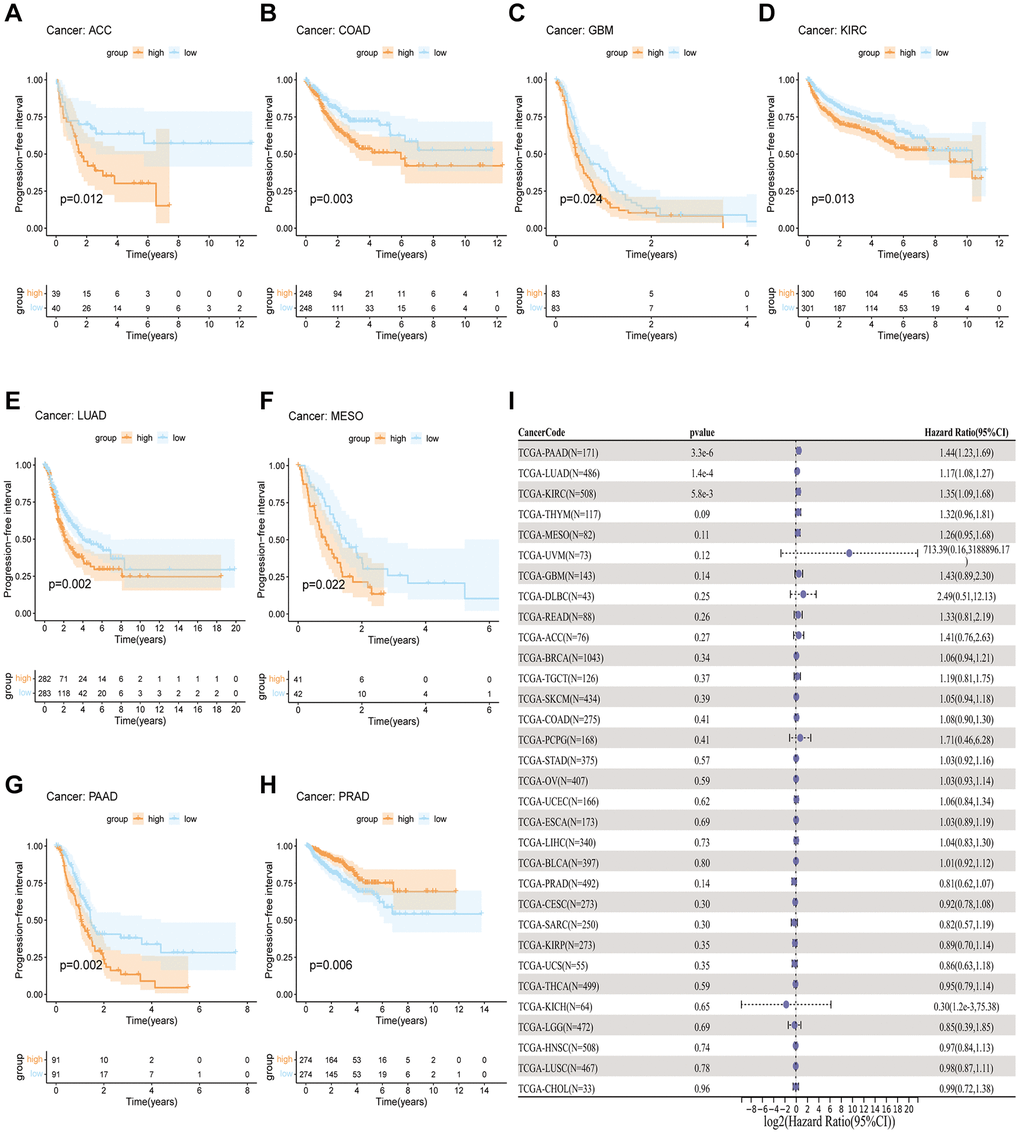
Figure 4.A comparison of PFI prognosis in various types of cancers according to GJB3 expression. (A–H) In the Kaplan-Meier curves, GJB3 expression is correlated with PFI expression. (I) Forest plot demonstrating the association between GJB3 and PFI.
Figure 4 — GJB3: a comprehensive biomarker in pan-cancer prognosis and immunotherapy prediction | Aging