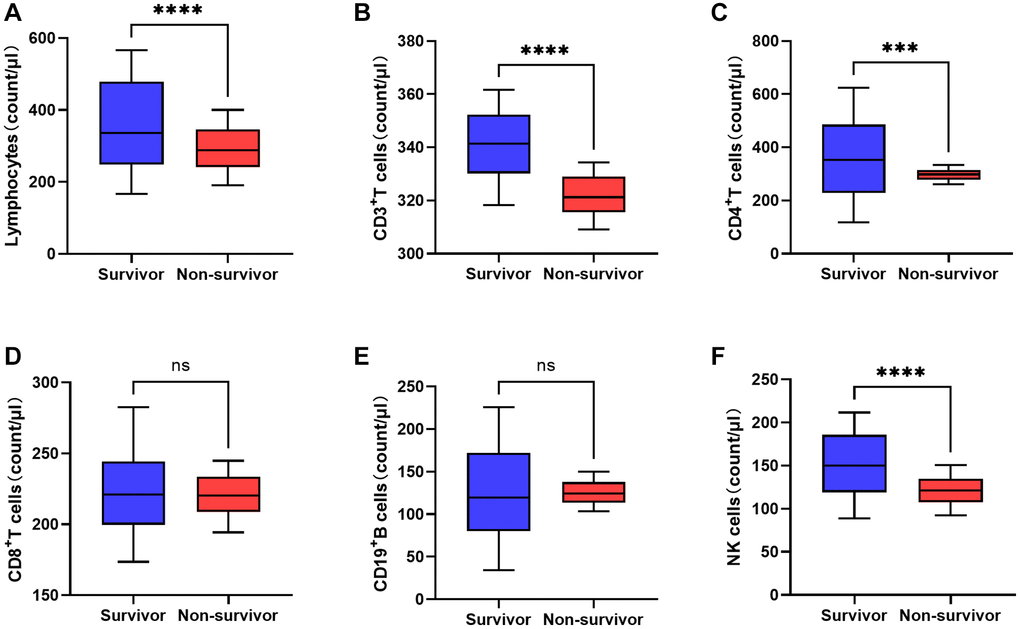
Figure 1.Comparison of peripheral lymphocyte subsets between non-survivor and survivor groups on the third day after admission (*P < 0.05, **P < 0.01, ***P < 0.001; ****P < 0.0001). (A) Lymphocytes. (B) CD3+T cells. (C) CD4+ T cells. (D) CD8+ T cells. (E) CD19+ B cells. (F) NK cells.