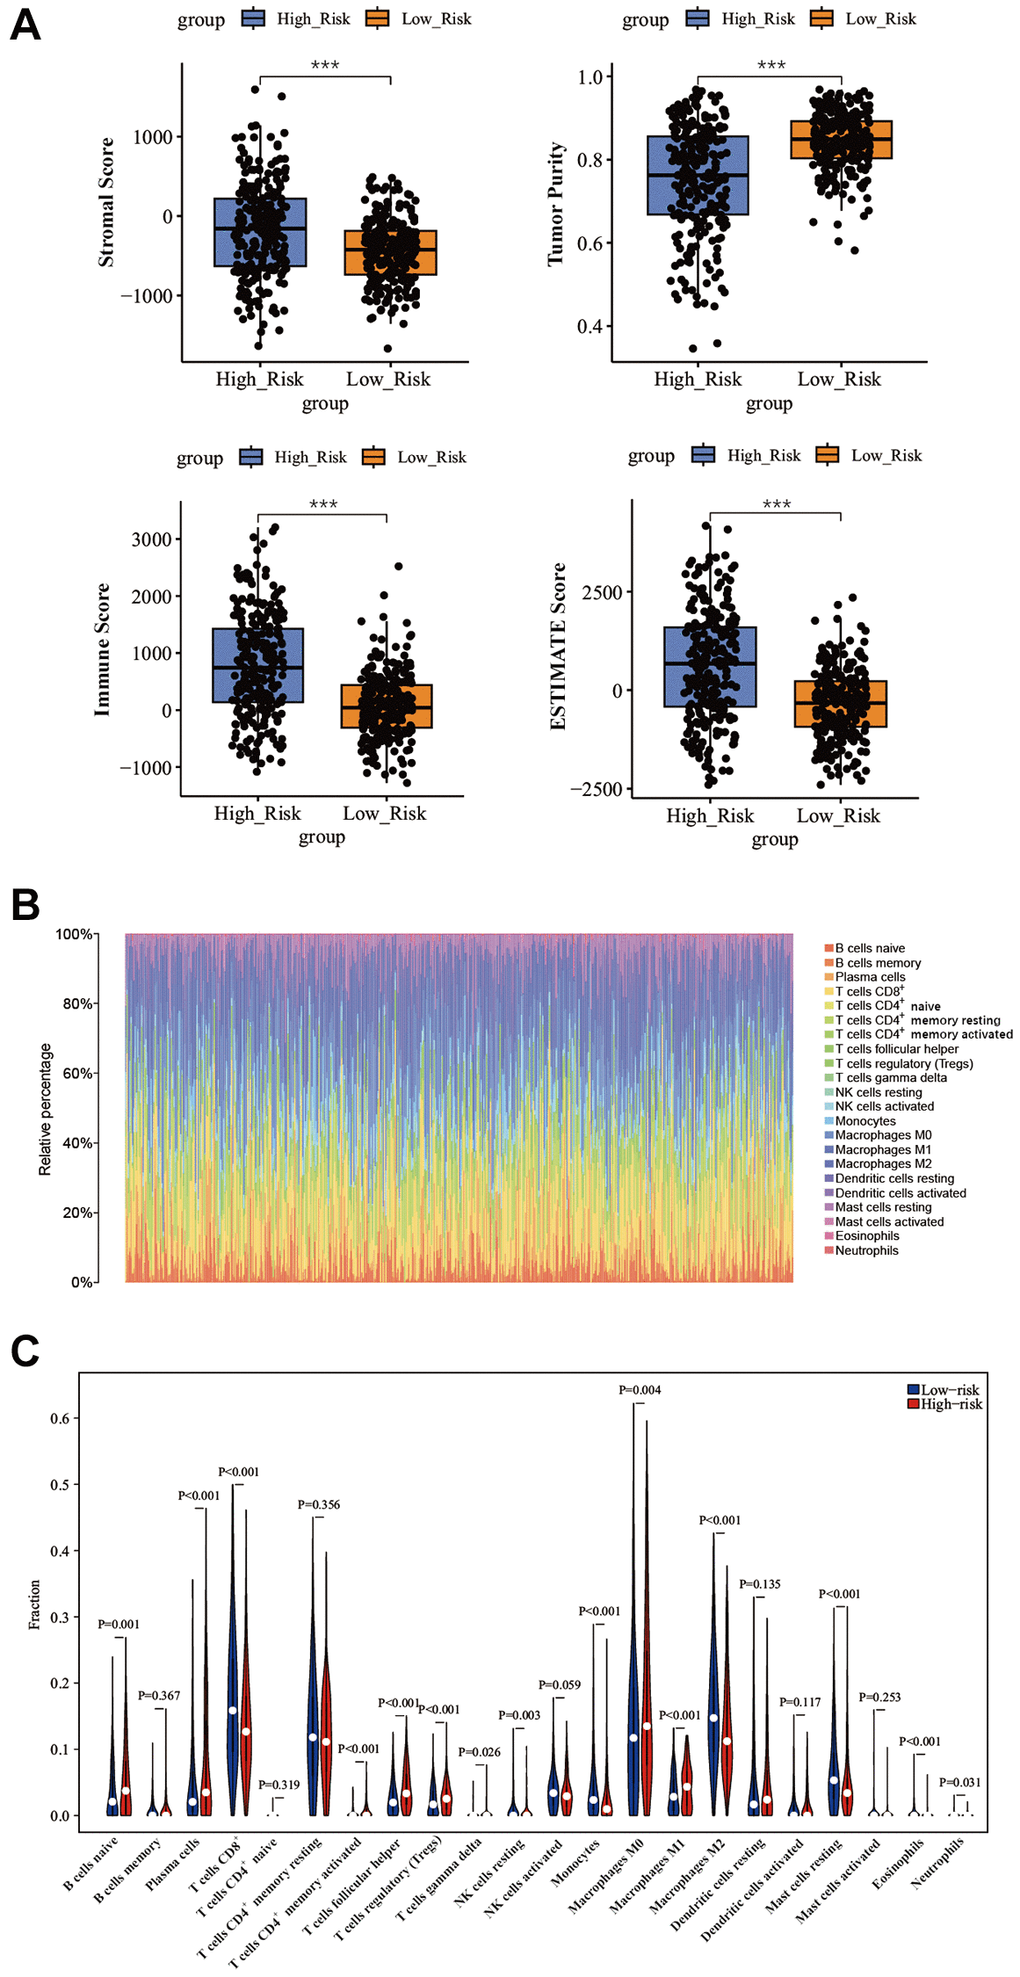
Figure 8.Correlation between immune cell infiltration and different risk scores. (A) Differences of TME between different risk groups by ESTIMATE algorithm. (B) Immune cell proportions for each tumor patient. (C) Analyzing the immune cell infiltration levels of PTC samples between different risk groups by CIBERSORT algorithm. *P < 0.05; **P < 0.01; ***P < 0.001.