Submit an Article
Navigate
Home
Editorial Board
Editorial Policies
Current Volume
Archive
Scientific Integrity
Publication Ethics Statements
Interviews with Outstanding Authors
Newsroom
Sponsored Conferences
Podcast
Contact
Special Collections
Submit an Article
Online ISSN: 1945-4589
Research Paper
|
Volume 16, Issue 8
|
pp. 7405–7425
Identification and validation of an anoikis-related genes signature for prognostic implication in papillary thyroid cancer
Back to article
Figure 7
(7 of 9)
−
100%
+
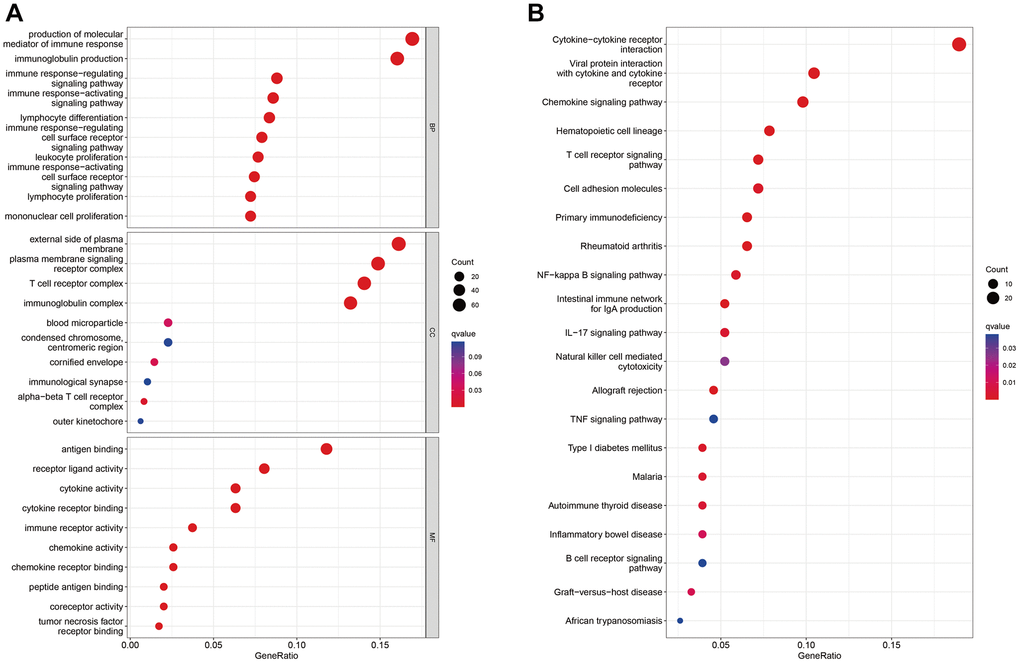
Figure 7.
Enrichment analysis of differentially expressed genes between patients in high- and low-risk groups in the TCGA cohort.
(
A
,
B
) GO (
A
) and KEGG (
B
) analysis results of differentially expressed genes.