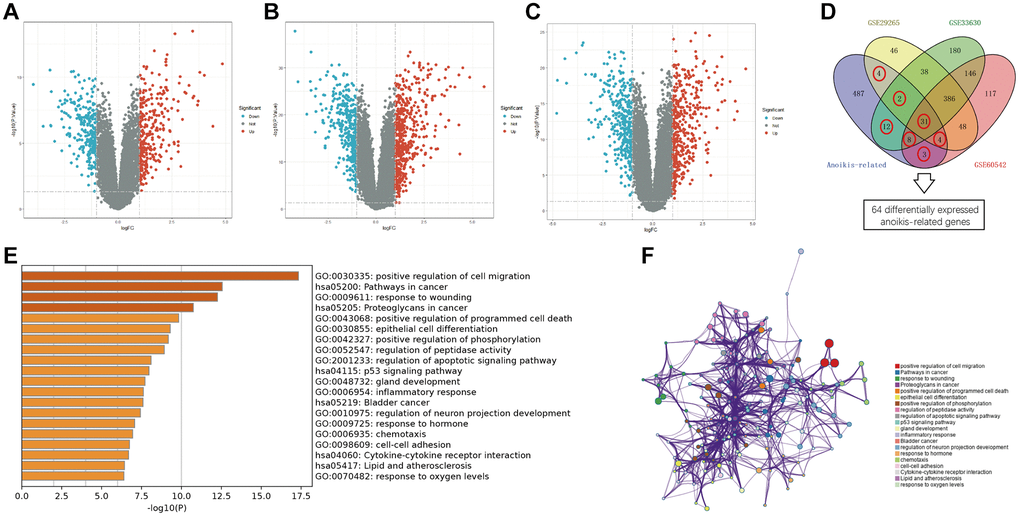
Figure 2.Overview of the differentially expressed anoikis-related genes in PTC. (A–C) Volcano plots of differentially expressed gens (DEGs) between PTC and normal tissues in GSE29265, GSE33630, and GSE60542. (D) Venn diagram showing the dysregulated anoikis-related genes common to the four datasets. (E) Bar graph showing the GO and KEGG analysis. (F) PPI network showing the distribution and relationship of the different enriched functions.