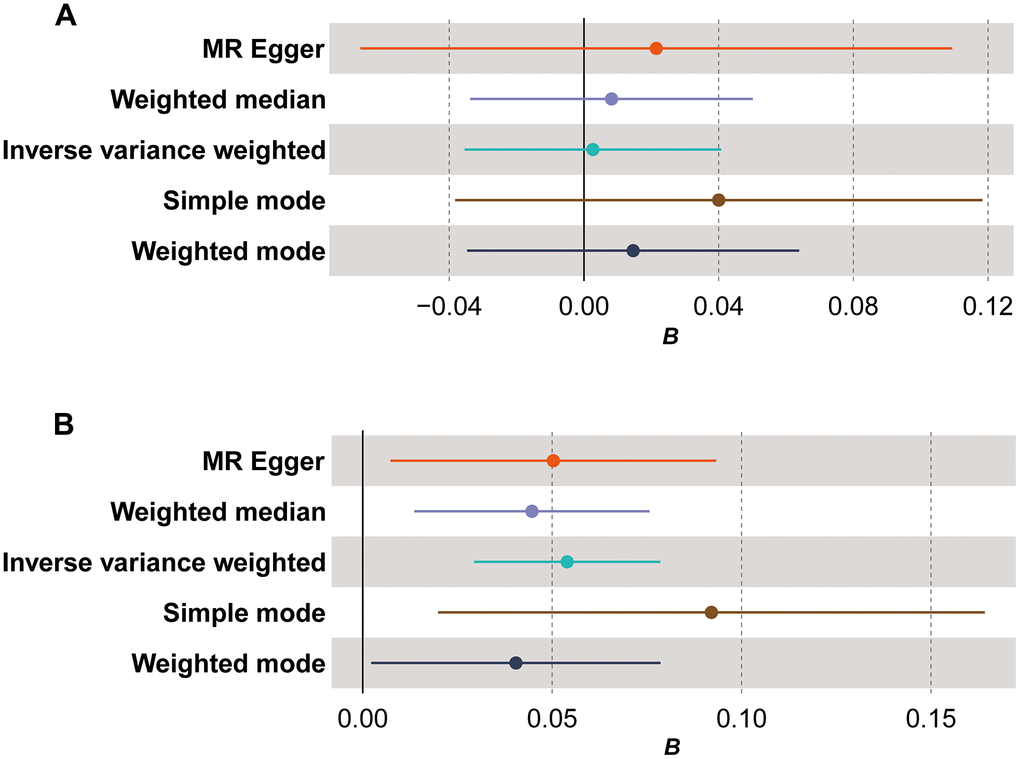
Figure 1.Forest plot for Mendelian randomization (MR) results. (A) The MR results for the forward analysis; (B) the MR results for the reverse analysis. The x-axis (B) shows effect estimates; dots represent primary effect estimate; horizontal lines depict the confidence interval of effect estimate.