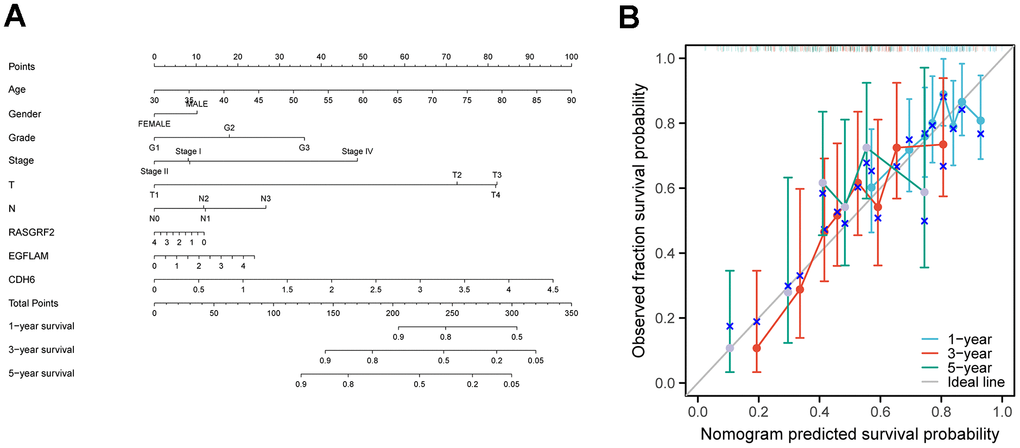
Figure 4.Construction of a nomogram for prognostic prediction of STAD patients. (A) Nomogram illustrating the 1-year, 3-year, and 5-year overall survival prediction for patients with STAD. (B) Calibration curves of a nomogram predicting 1-year, 3-year, and 5-year overall survival.