Submit an Article
Navigate
Home
Editorial Board
Editorial Policies
Current Volume
Archive
Scientific Integrity
Publication Ethics Statements
Interviews with Outstanding Authors
Newsroom
Sponsored Conferences
Podcast
Contact
Special Collections
Submit an Article
Online ISSN: 1945-4589
Research Paper
|
Volume 16, Issue 8
|
pp. 7188–7216
Integrative analysis based on the cell cycle-related genes identifies TPX2 as a novel prognostic biomarker associated with tumor immunity in breast cancer
Back to article
Figure 8
(8 of 10)
−
100%
+
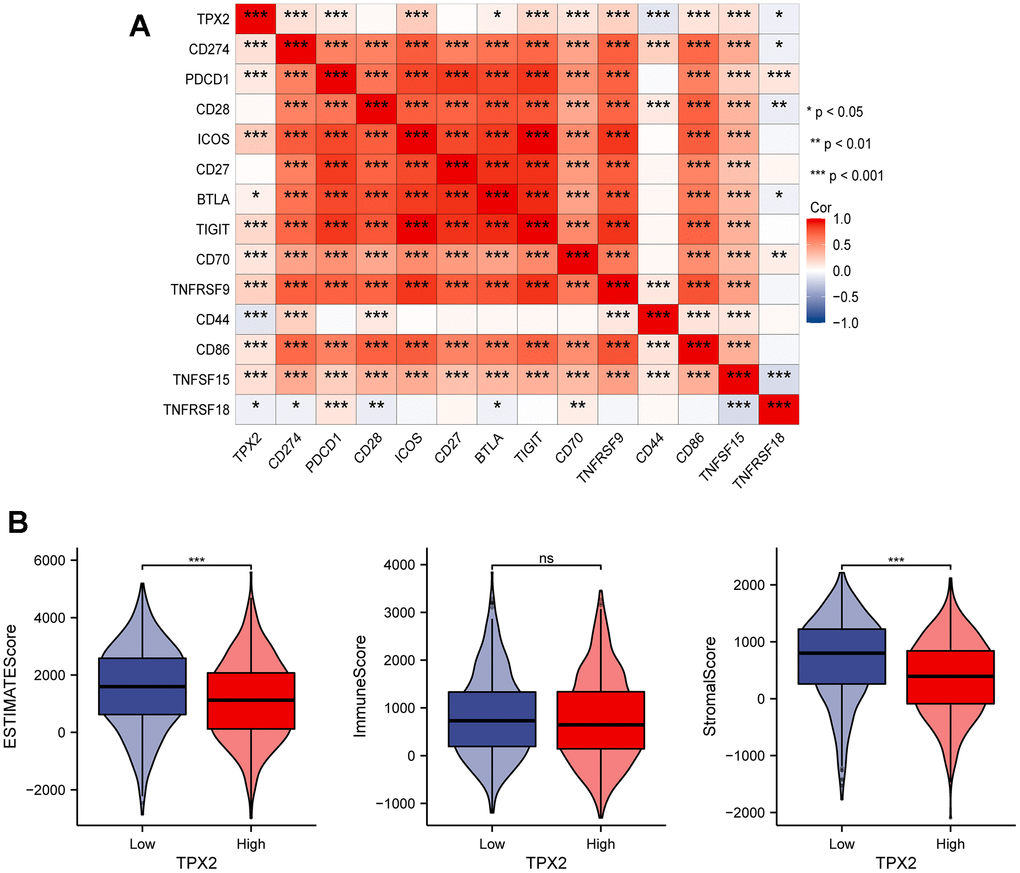
Figure 8.
(
A
) Correlation analysis between TPX2 expression and representative immune checkpoints from TCGA database. (
B
) The relationship between TPX2 expression and immune microenvironment. *P < 0.05, **P < 0.01, ***P < 0.001.