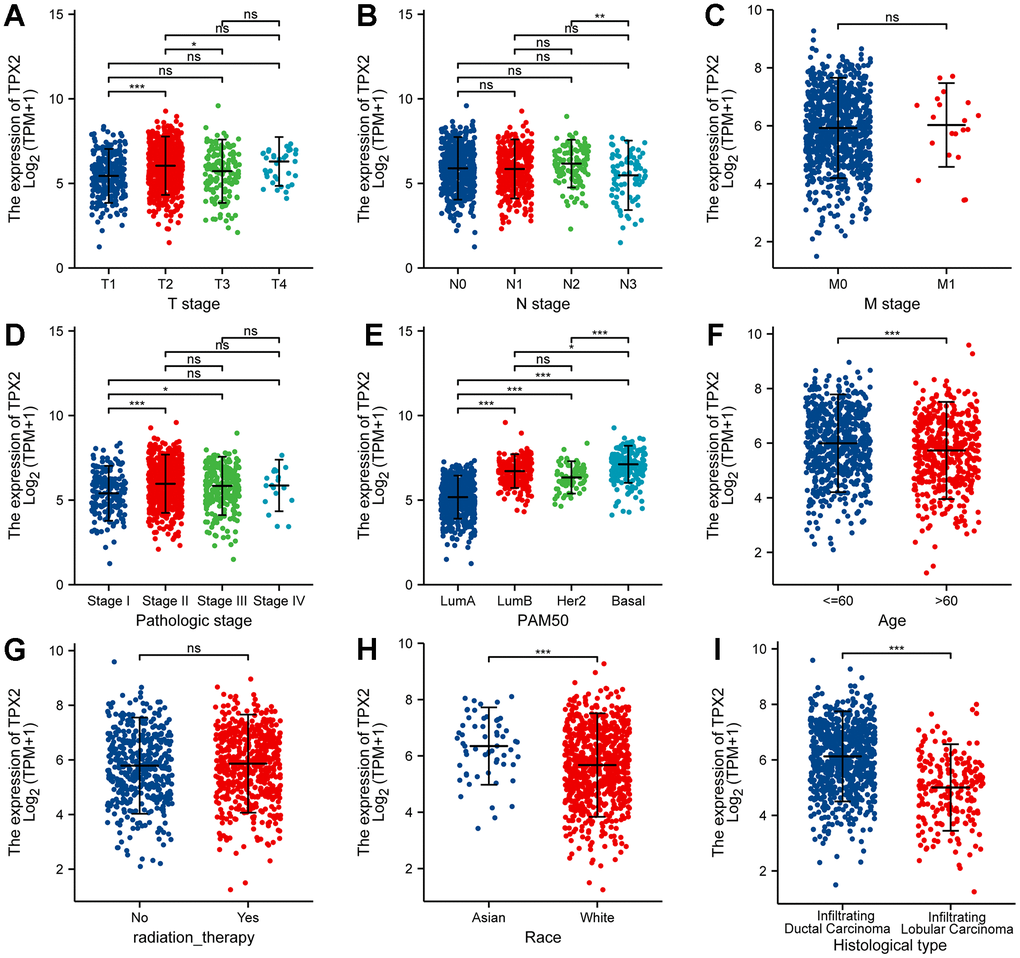
Figure 6.Correlation between TPX2 expression and the clinicopathological features of breast cancer patients for (A) T stage, (B) N stage, (C) M stage, (D) pathologic stage, (E) PAM50, (F) Age, (G) radiation therapy, (H) race and (I) histologic type. *P < 0.05, **P < 0.01, ***P < 0.001.