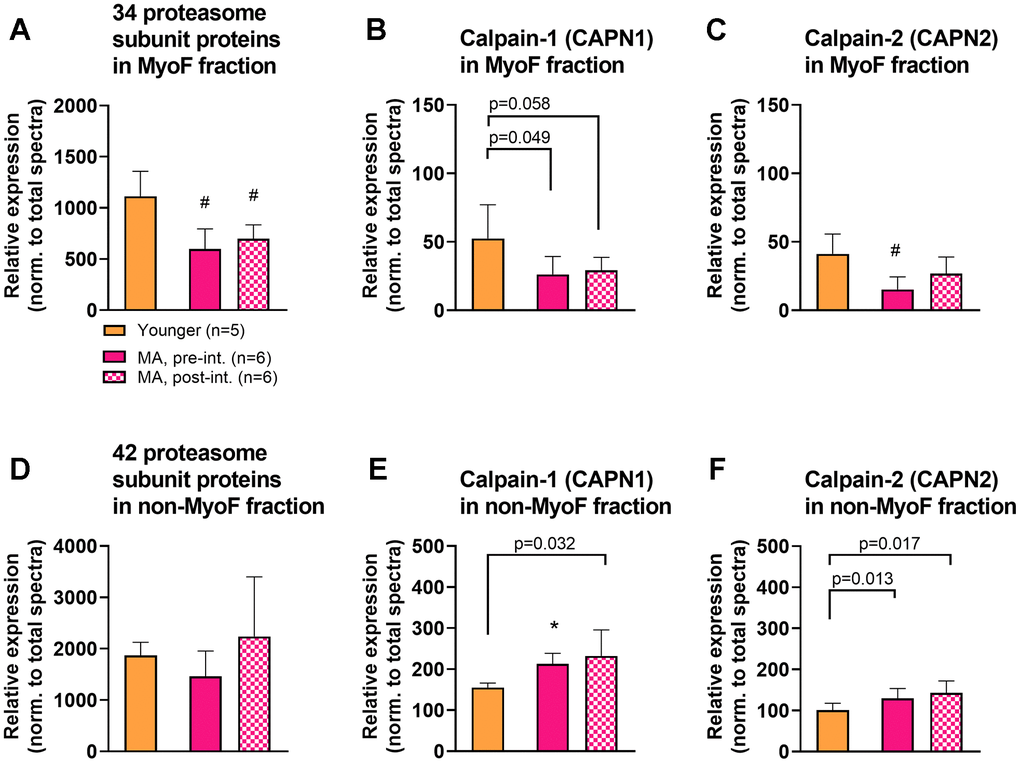
Figure 5.MyoF and non-MyoF proteasome and calpain proteins. Legend: Data presented for Y and MA prior to and following eight weeks of knee extensor training include proteasome subunits and calpains 1/2 in the MyoF fraction (A–C) and non-MyoF fraction (D–F). Data are presented as mean ± standard deviations for individual protein spectra values (normalized to total run spectra values). Symbols: #, indicates lower in MA versus Y at one or both time points (p<0.01); *, indicates greater in MA versus Y at one or both time points (p<0.01). Notes: Certain p-values not meeting the significance criteria for these data were presented due to the visual differences observed between cohorts.