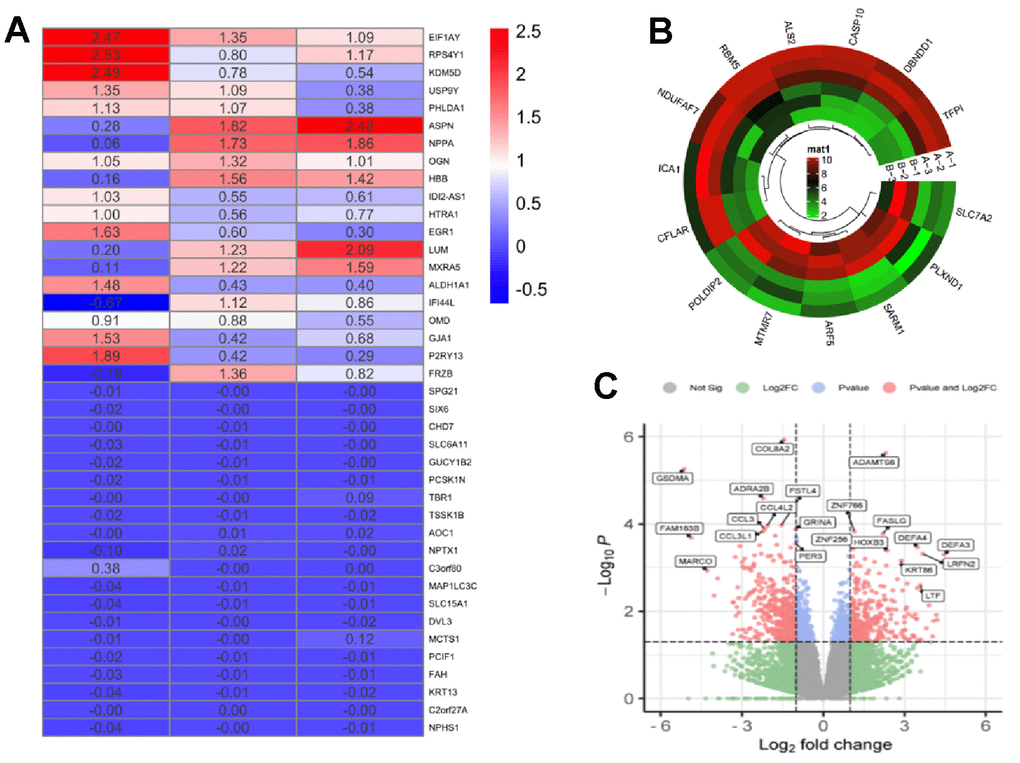
Figure 2.Differentially expressed genes of skin aging identification. (A) Heat map of DEGs in the GSE155789; (B) Cluster of DEGs in the GSE155789; (C) Volcano plot of differentially DEGs in the GSE155789. group C: normal HaCaT cells; group VA: 100 nM retinol in HaCaT cells.