Submit an Article
Navigate
Home
Editorial Board
Editorial Policies
Current Volume
Archive
Scientific Integrity
Publication Ethics Statements
Interviews with Outstanding Authors
Newsroom
Sponsored Conferences
Podcast
Contact
Special Collections
Submit an Article
Online ISSN: 1945-4589
Research Paper
|
Volume 16, Issue 8
|
pp. 7141–7152
Aberrant expression of thyroidal hormone receptor α exasperating mitochondrial dysfunction induced sarcopenia in aged mice
Back to article
Figure 3
(3 of 5)
−
100%
+
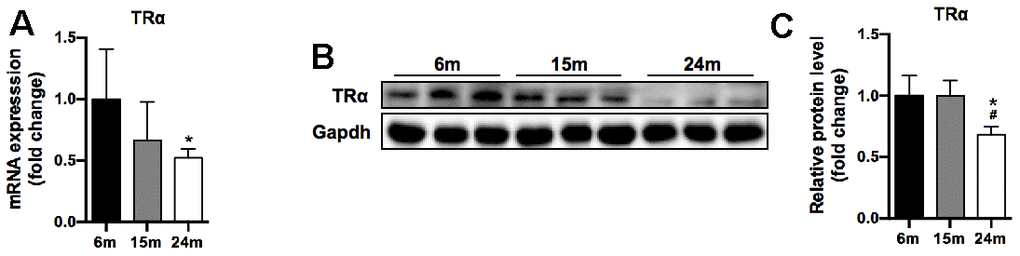
Figure 3.
TRα mRNA and protein levels of SM in mice during aging.
(
A
) mRNA level of TRα, n=7; (
B
) Representative Western blots and (
C
) quantification of TRα and Gapdh (loading control), n=3. *p<0.05 vs. 6m group; #p<0.05 vs. 15m group.