Submit an Article
Navigate
Home
Editorial Board
Editorial Policies
Current Volume
Archive
Scientific Integrity
Publication Ethics Statements
Interviews with Outstanding Authors
Newsroom
Sponsored Conferences
Podcast
Contact
Special Collections
Submit an Article
Online ISSN: 1945-4589
Research Paper
|
Volume 16, Issue 8
|
pp. 7131–7140
Treatment patterns and survival in T4b esophageal cancer: a retrospective cohort study
Back to article
Figure 4
(4 of 5)
−
100%
+
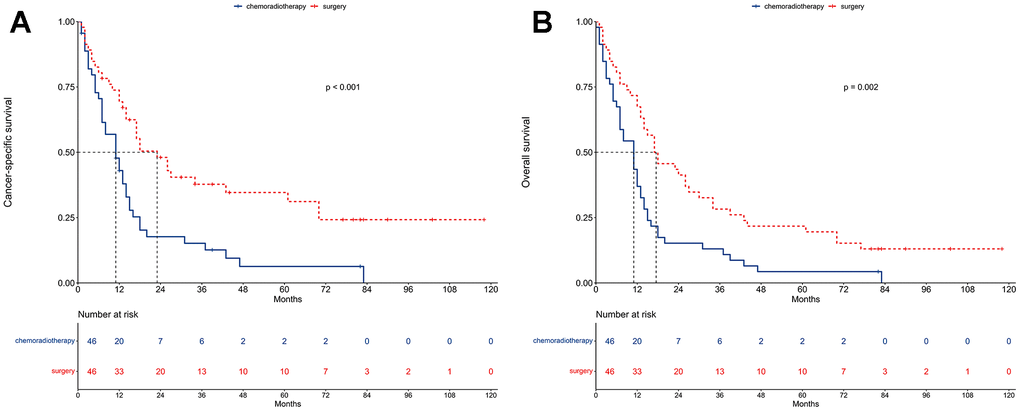
Figure 4.
Survival between chemoradiotherapy and surgery groups after propensity score matching.
(
A
) Cancer-specific survival. (
B
) Overall survival.