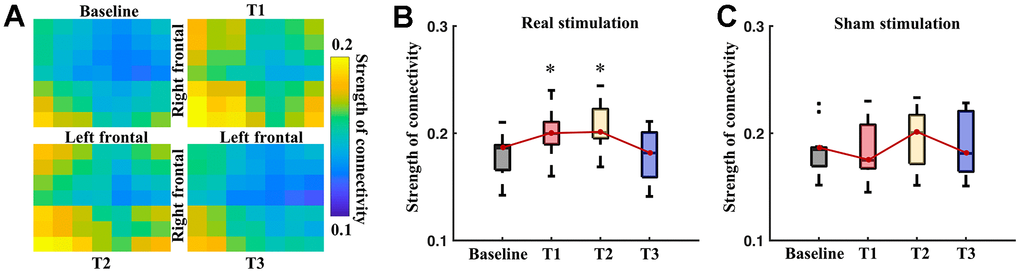
Figure 5.Inter-hemisphere connectivity of the frontal regions. (A) Pairwise connectivity of inter-hemispheric frontal regions at different time points. Boxplots show average strength of inter-hemisphere connectivity of the frontal region at different time points of real (B) and sham (C) stimulation. * means significance in the comparison between T1, T2, T3 and baseline, using one-way repeated ANOVA with post-hoc t-tests after Bonferroni correction.