Submit an Article
Navigate
Home
Editorial Board
Editorial Policies
Current Volume
Archive
Scientific Integrity
Publication Ethics Statements
Interviews with Outstanding Authors
Newsroom
Sponsored Conferences
Podcast
Contact
Special Collections
Submit an Article
Online ISSN: 1945-4589
Research Paper
|
Volume 16, Issue 8
|
pp. 7073–7100
Comprehensive characterization of β-alanine metabolism-related genes in HCC identified a novel prognostic signature related to clinical outcomes
Back to article
Figure 2
(2 of 11)
−
100%
+
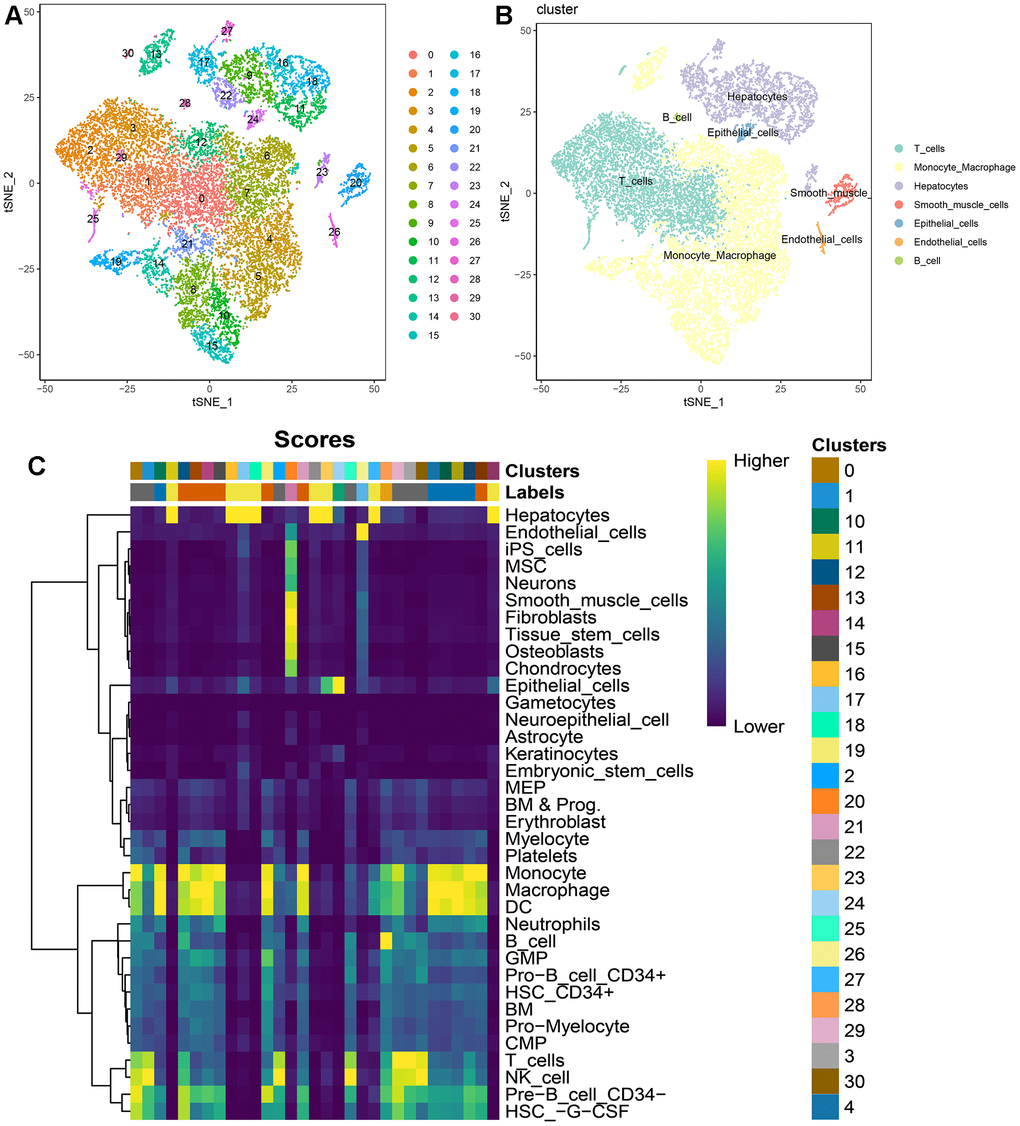
Figure 2.
Single-cell atlas of 2 HCC patients.
(
A
) t-SNE dimensionality reduction subtypes; (
B
) t-SNE dimensionality reduction cell annotations; (
C
) singleR automated annotation results.