Submit an Article
Navigate
Home
Editorial Board
Editorial Policies
Current Volume
Archive
Scientific Integrity
Publication Ethics Statements
Interviews with Outstanding Authors
Newsroom
Sponsored Conferences
Podcast
Contact
Special Collections
Submit an Article
Online ISSN: 1945-4589
Research Paper
|
Volume 16, Issue 8
|
pp. 7060–7072
Keratin 6A (KRT6A) promotes radioresistance, invasion, and metastasis in lung cancer via p53 signaling pathway
Back to article
Figure 3
(3 of 6)
−
100%
+
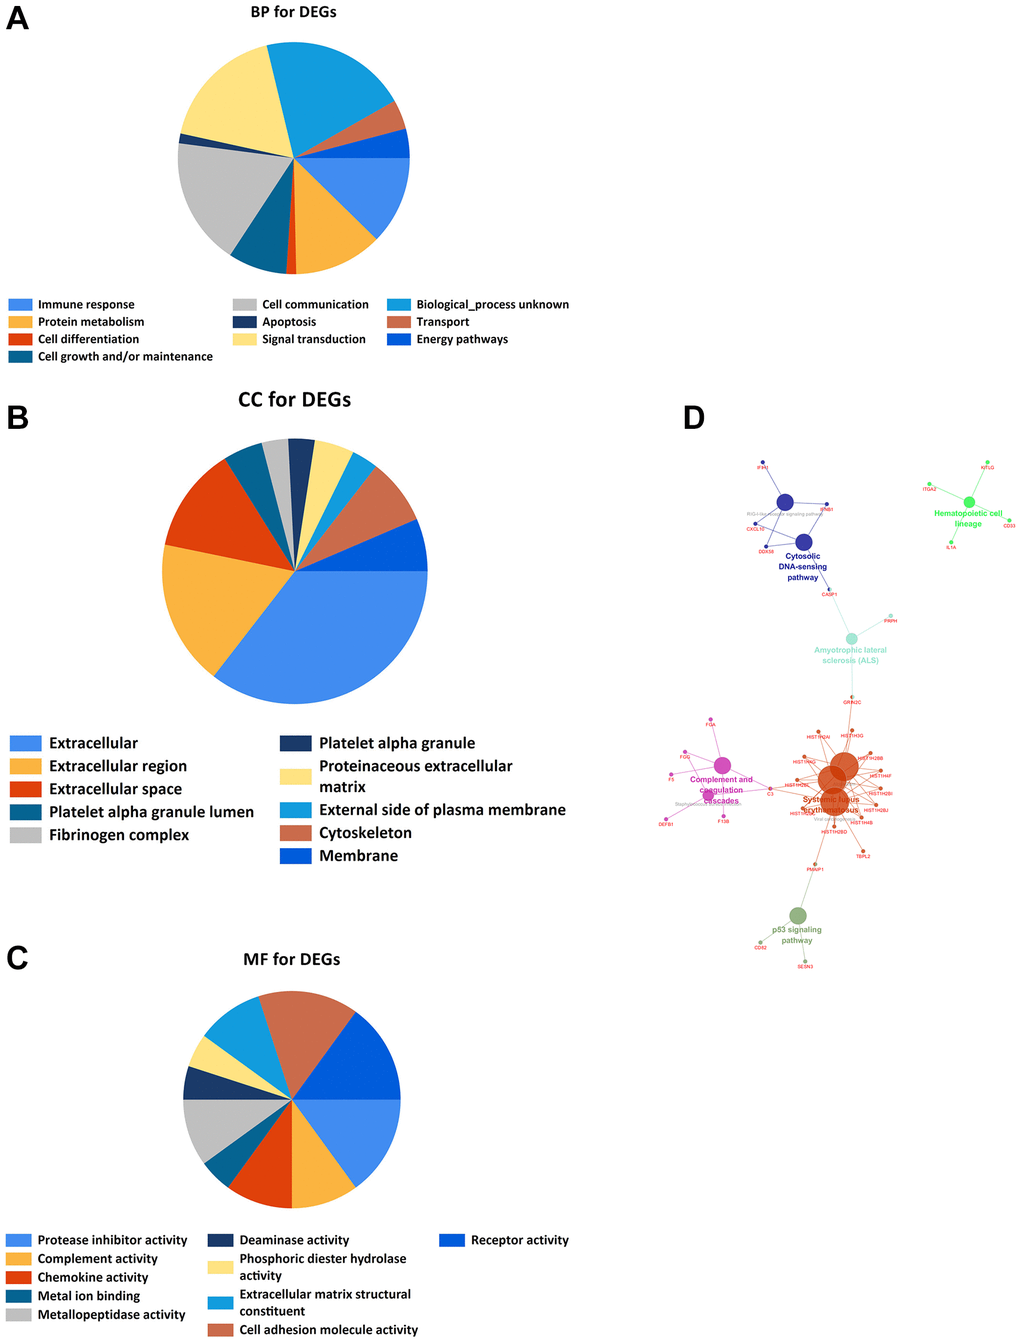
Figure 3.
GO and KEGG enrichment analyses.
(
A
) Bioprocess enrichment analysis; (
B
) Cell component enrichment analysis; (
C
) Molecular functional enrichment analysis; (
D
) KEGG signaling pathway enrichment analysis.