Submit an Article
Navigate
Home
Editorial Board
Editorial Policies
Current Volume
Archive
Scientific Integrity
Publication Ethics Statements
Interviews with Outstanding Authors
Newsroom
Sponsored Conferences
Podcast
Contact
Special Collections
Submit an Article
Online ISSN: 1945-4589
Research Paper
|
Volume 16, Issue 8
|
pp. 7022–7042
Mining and exploration of rehabilitation nursing targets for colorectal cancer
Back to article
Figure 7
(7 of 11)
−
100%
+
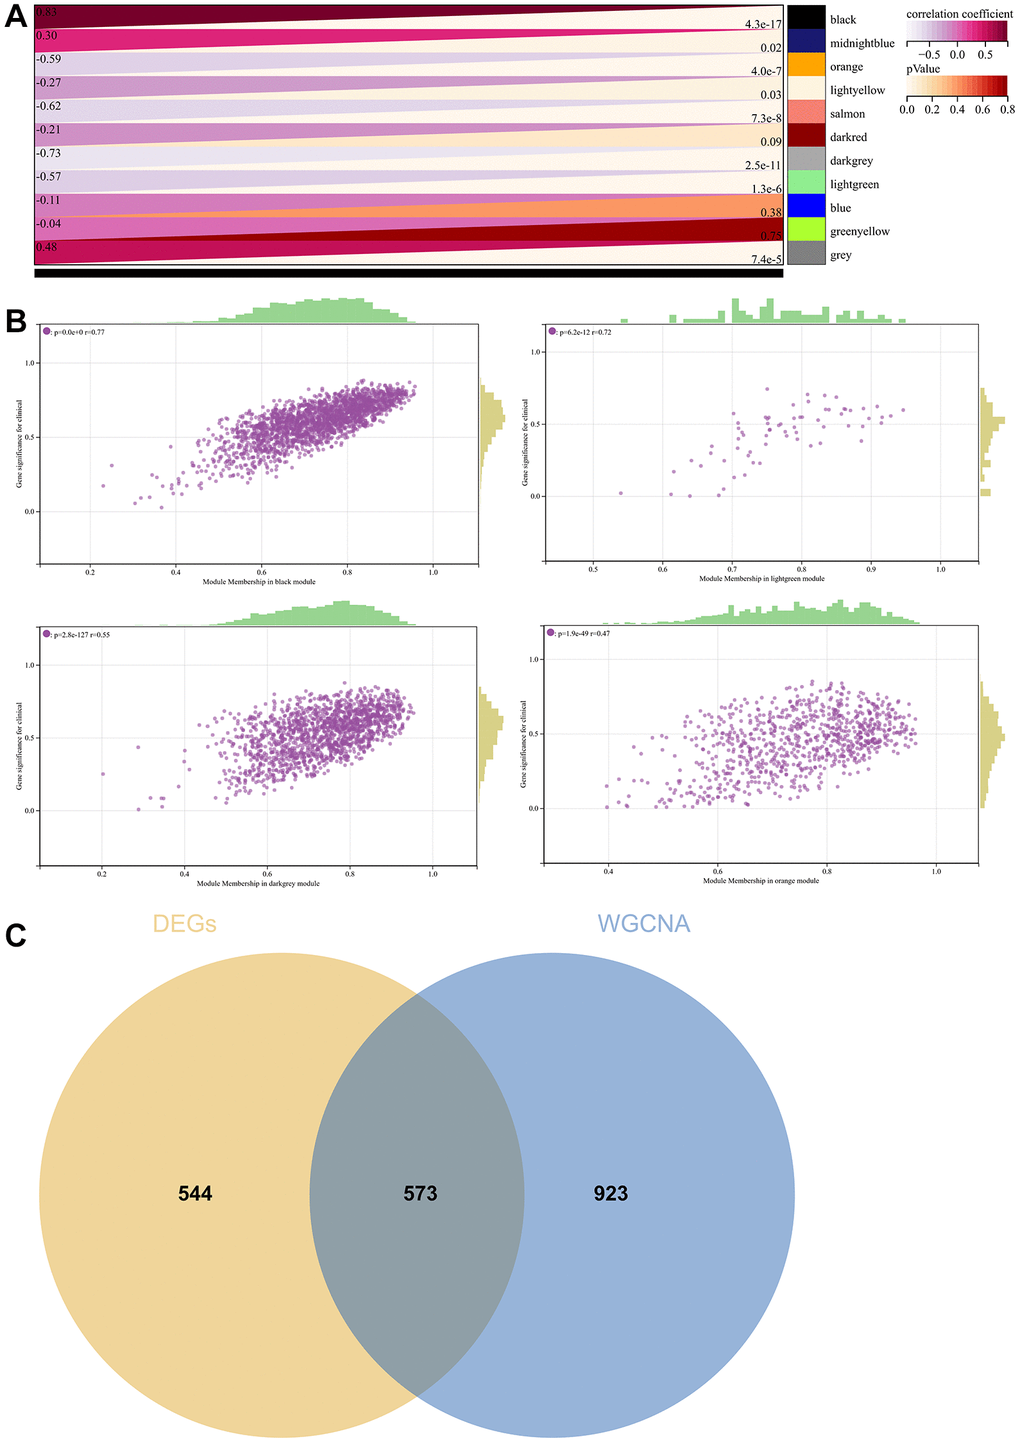
Figure 7.
WGCNA.
(
A
) A module and a phenotypic correlation heatmap. (
B
) The corresponding hub gene of GS and MM correlation scatter plot. (
C
) Venn diagram of WGCNA and the differentially expressed genes screened by DEGs, and their intersections.