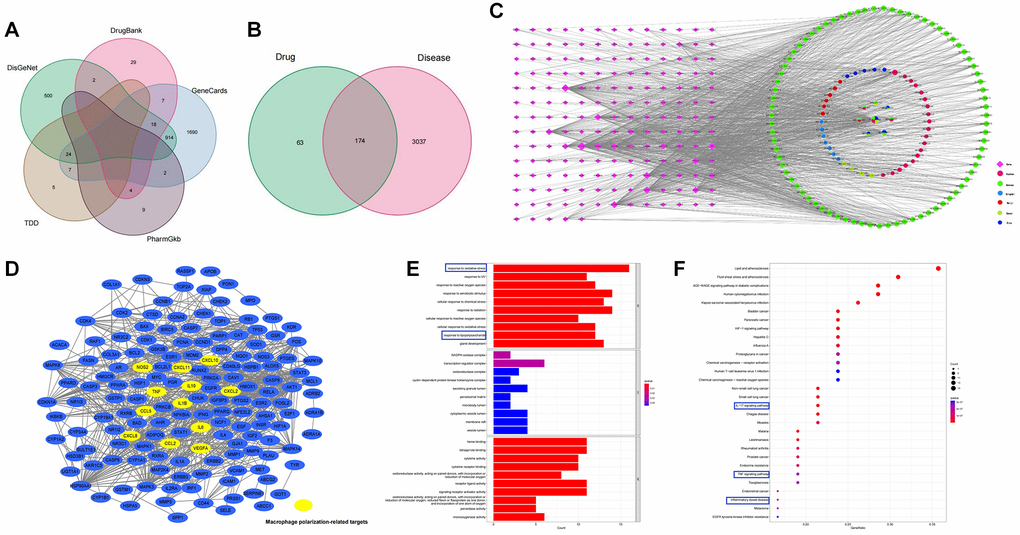
Figure 1.Pharmacology analysis of CSD. (A) Venn diagram of UC-associated genes in five databases; (B) Venn diagram of CSD target genes and differentially expressed genes in UC; (C) The CSD–active compound–target network; (D) Genes associated with macrophage polarization in PPI network; (E) GO analysis of CSD-targeted genes (p < 0.05); (F) KEGG analysis of CSD-targeted genes.