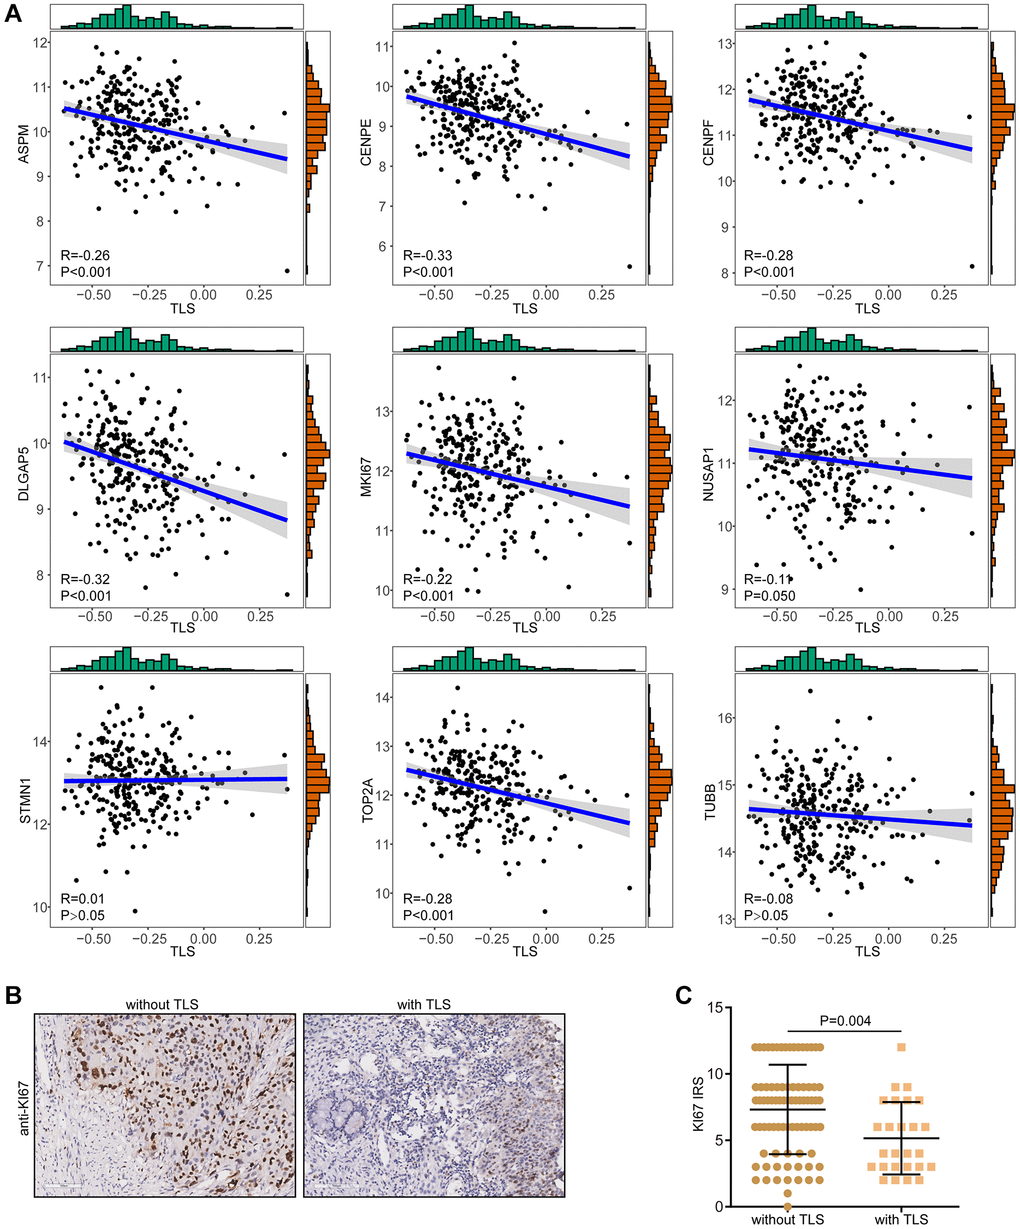
Figure 6.Correlations between TLS and proliferation biomarkers. (A) Correlations between TLS score and a total of nine proliferation biomarkers in the TCGA-CESC cohort. (B, C) Representative images revealing KI67 expression in CESC samples with or without TLS and semi-quantitative analysis.