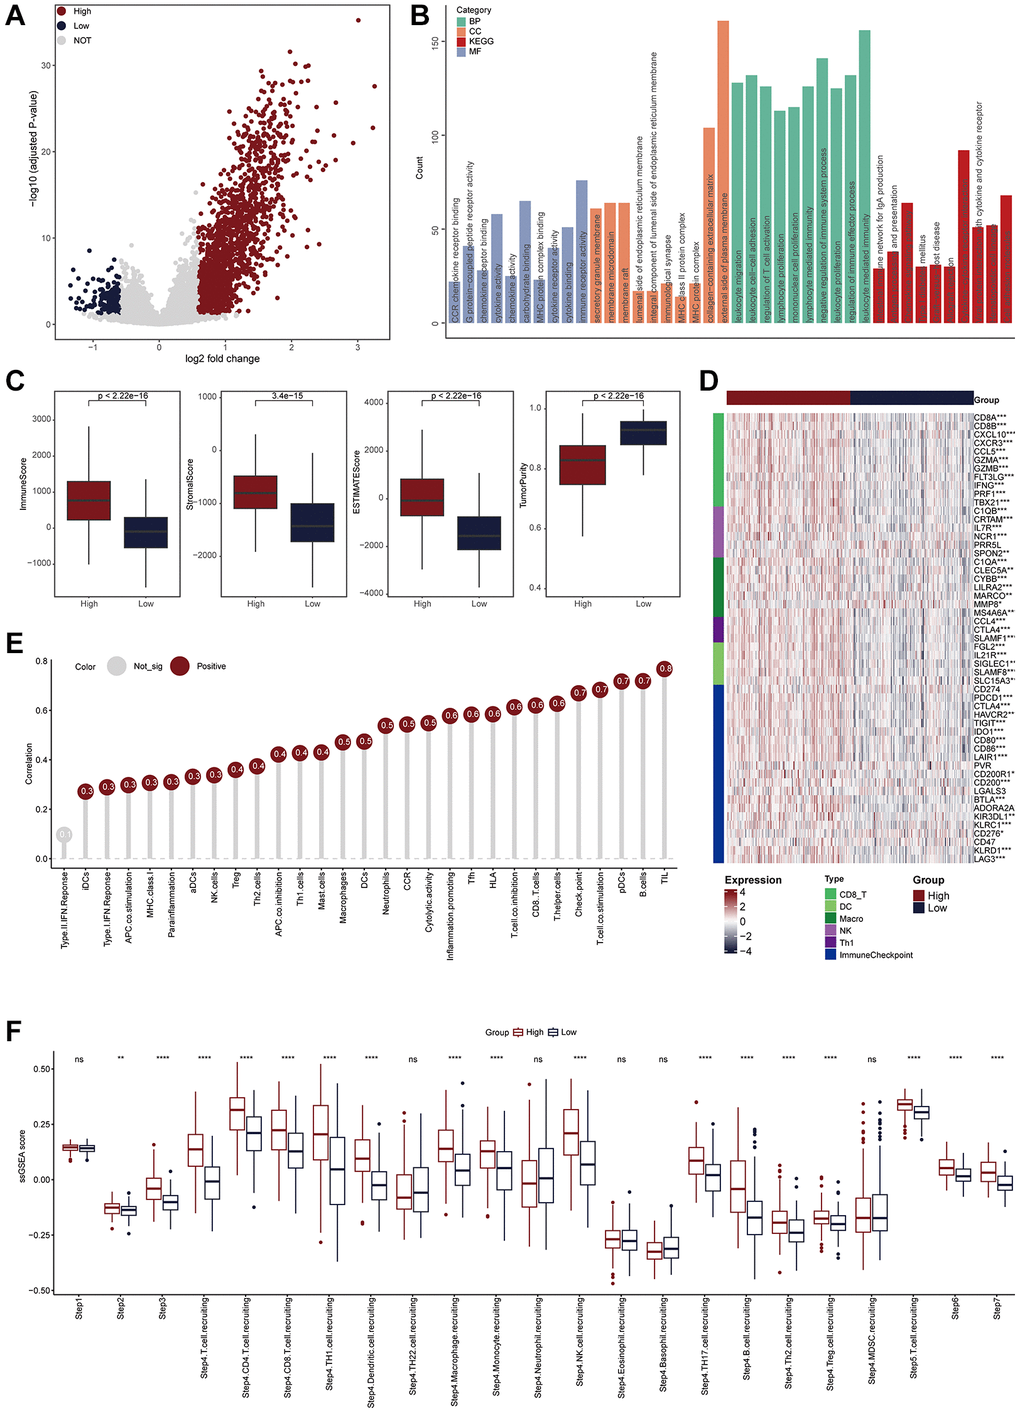
Figure 3.TLS was positively correlated with immunological scores in the TCGA-CESC cohort. (A) Volcano plot showing the DEGs for the TLS-high and low groups in the TCGA-CESC cohort. Red point: the up-regulated genes of TLS-high group. Blue point: the up-regulated genes of TLS-low group. Grey point: genes with no statistical significance. (B) Biological pathways enriched in the TLS-high group. (C) Comparison of StromalScore, ImmuneScore, ESTIMATEScore and tumor purity between TLS-high and low groups. (D) Heatmap showing the expression of biomarkers of immune subpopulations and immune checkpoints in the TCGA-CESC cohort. (E) The correlation between TLS expression and the enrichment scores of immune subpopulations and immune-related signaling pathways in the TCGA-UCEC cohort. (F) Comparing the enrichment scores of each step in the cancer immunity cycle between TLS-high and low groups.