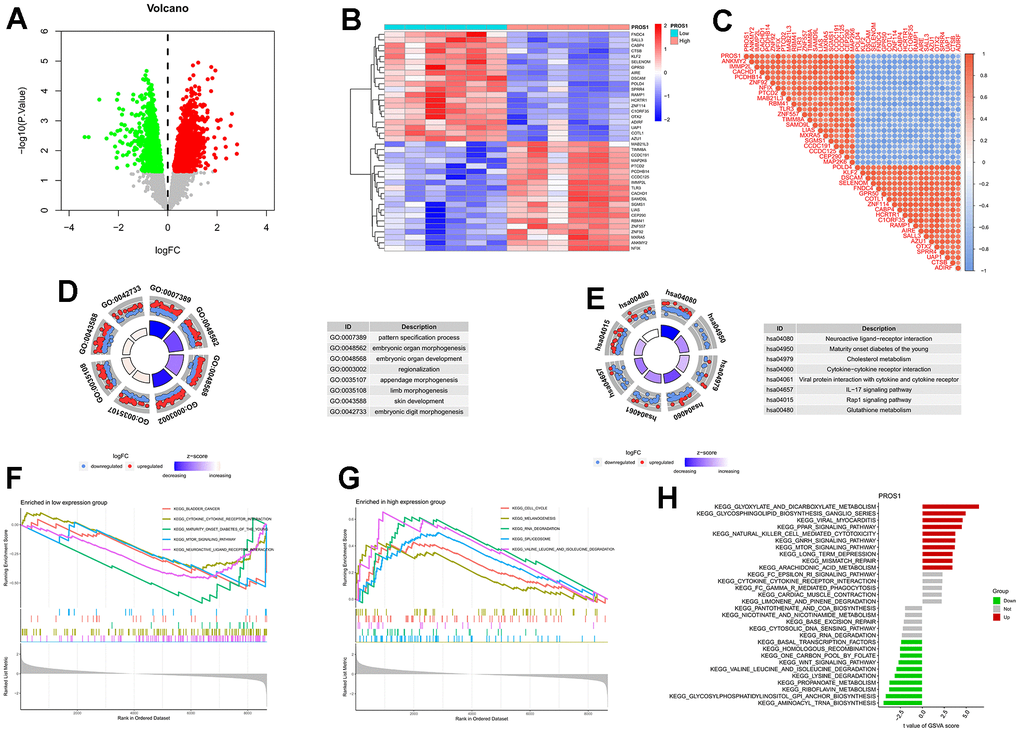
Figure 5.Differential analysis and enrichment analysis of genes related to PROS1. (A) Volcano plot for differential analysis. (B) Differential analysis heatmap; (C) Correlation analysis heatmap; (D) Differential gene GO analysis; (E) Differential gene KEGG analysis; (F) GSEA analysis of downregulated genes; (G) GSEA analysis of upregulated genes; (H) PROS1-related GSVA analysis.