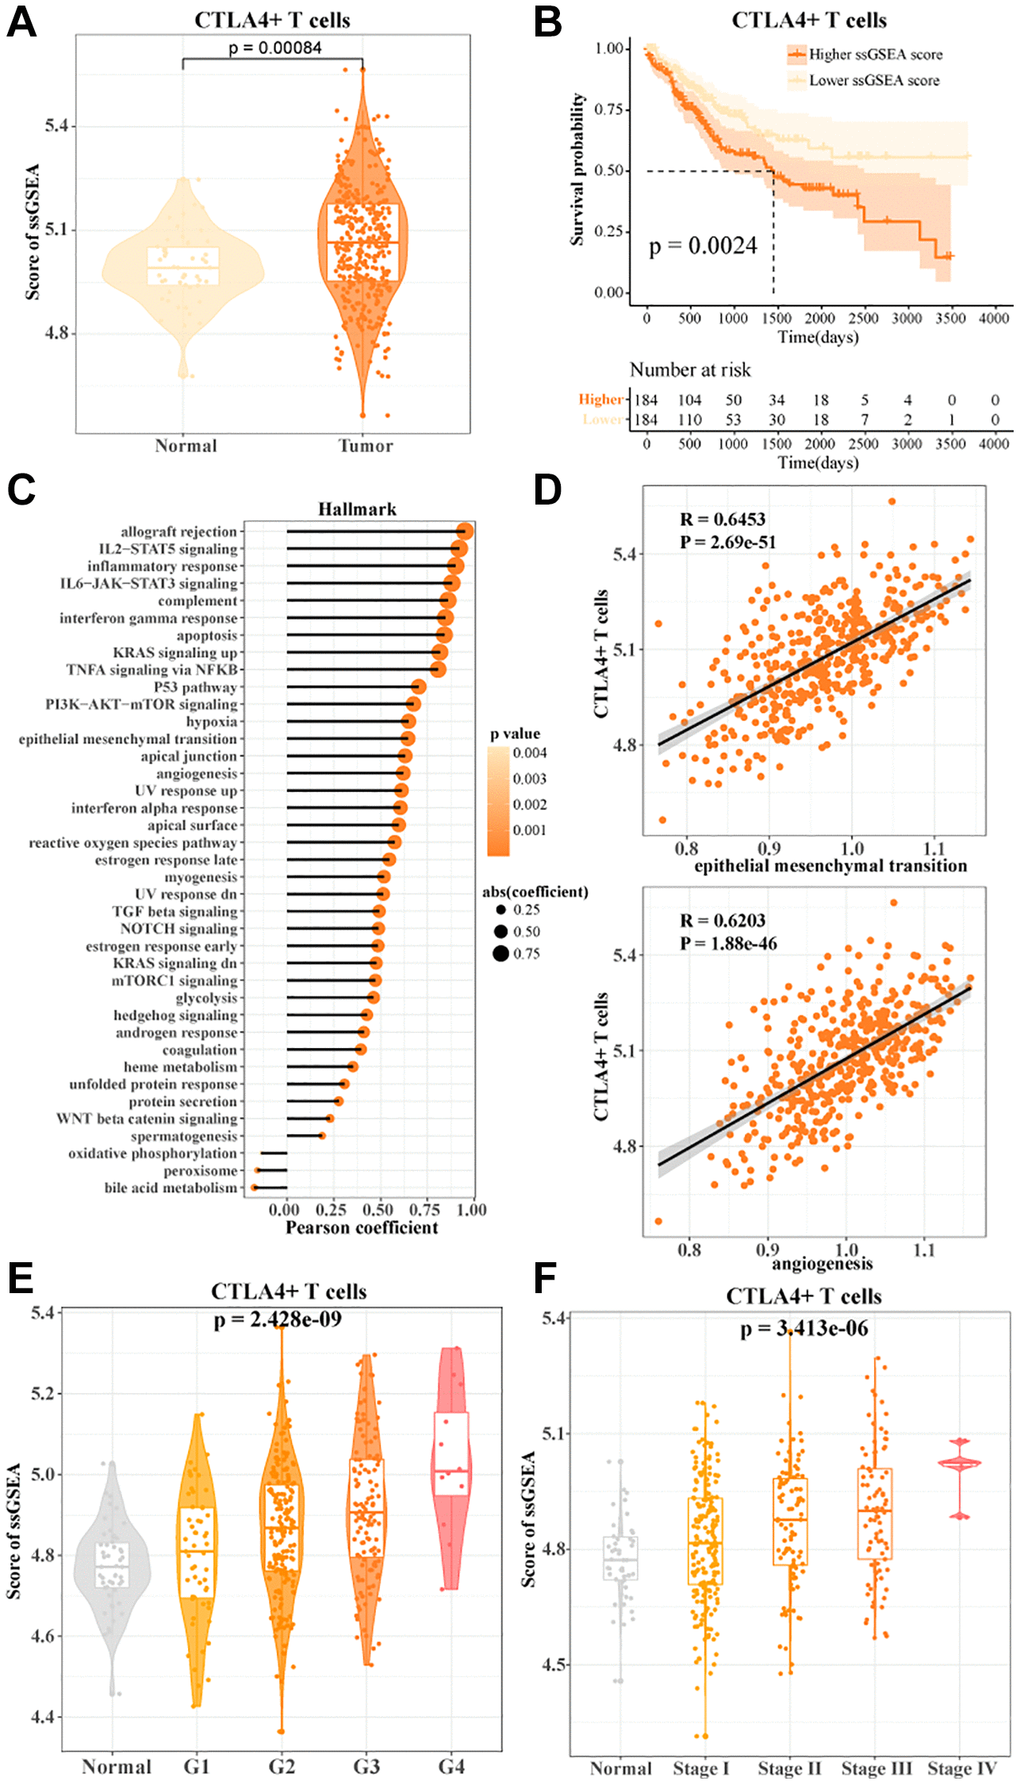
Figure 4.CTLA4+ T cells promoted HCC progression. (A) The ssGSEA score of CTLA4+ T cells in normal and tumor tissues in TCGA-LIHC data. (B) K-M curves of HCC patients in the high/low CTLA4+ T cells scoring groups. (C, D) Pearson's correlation between CTLA4+ T cells scores and cancer-related pathways. (E, F) CTLA4+ T cells scores in normal tissue and grade subgroups, stage subgroups.