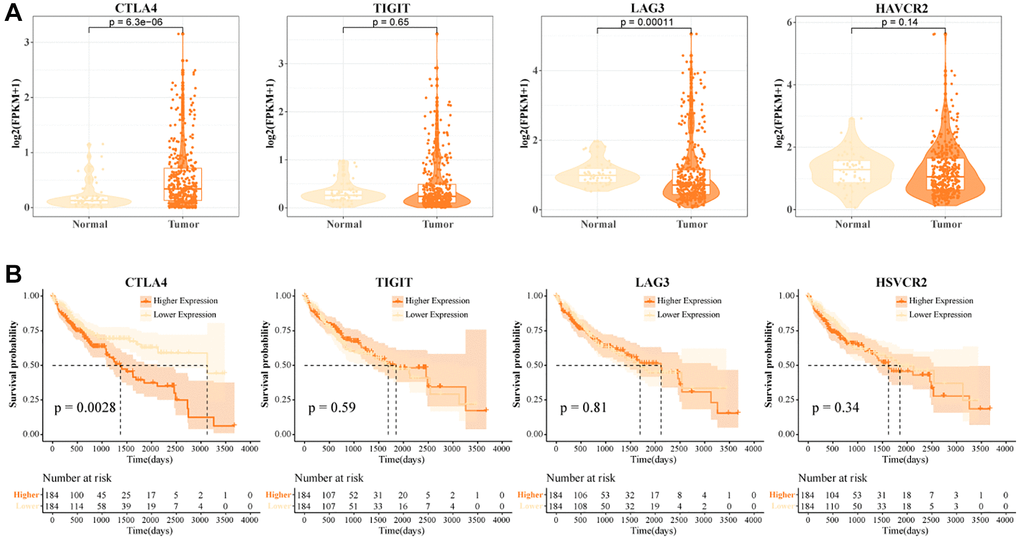
Figure 3.High CTLA4+ T cells portend a poor prognosis for HCC. (A) Expression levels of CTLA4, TIGIT, LAG3, and HAVCR2 in tumor tissues and normal tissues in TCGA-LIHC data. (B) K-M curves of HCC patients in CTLA4, TIGIT, LAG3, and HAVCR2 subgroups in TCGA-LIHC data.