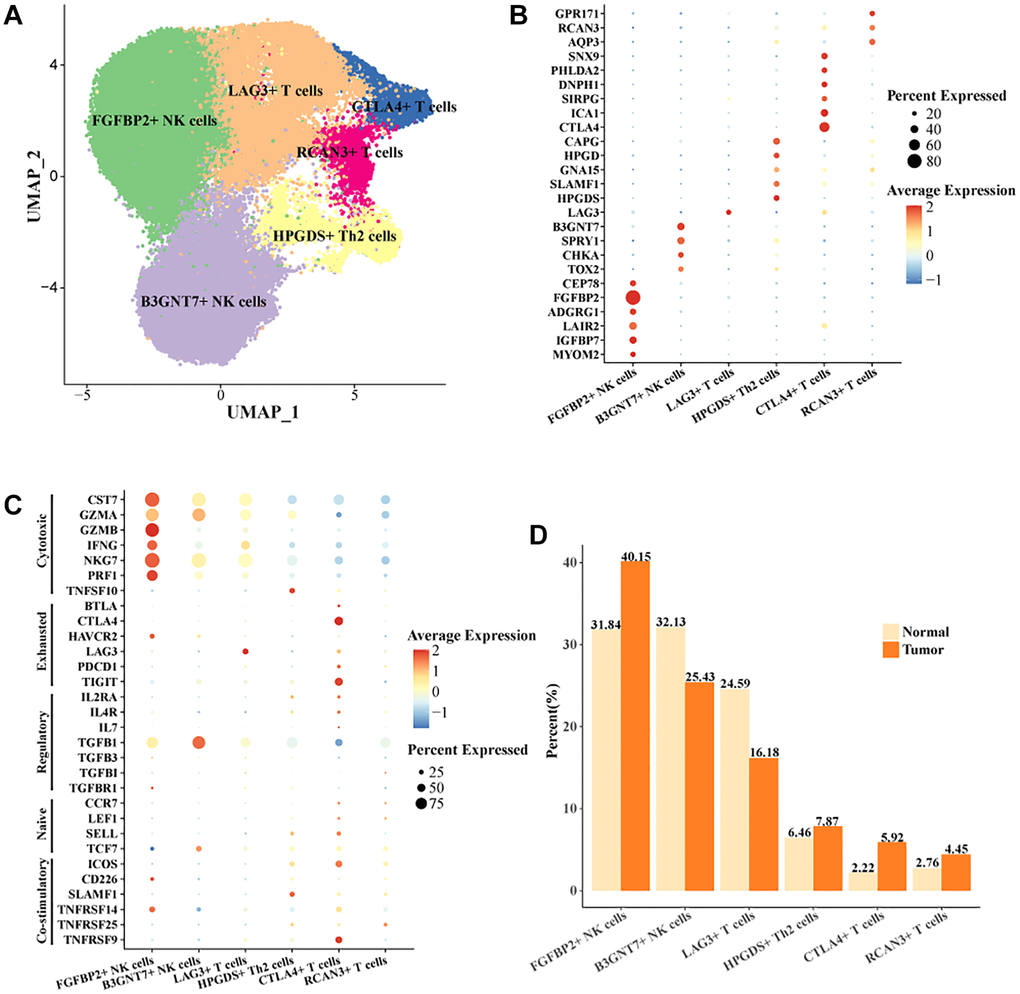
Figure 2.Cell landscape of exhausted FGFBP2+ NK cells, CTLA4+ T cells in HCC. (A) Distribution of 6 cell subtypes in NK cells and T cells. (B, C) Expression levels of marker genes in the 6 cell subtypes. (D) Proportion of the 6 cell subtypes in tumor tissues and normal tissues.