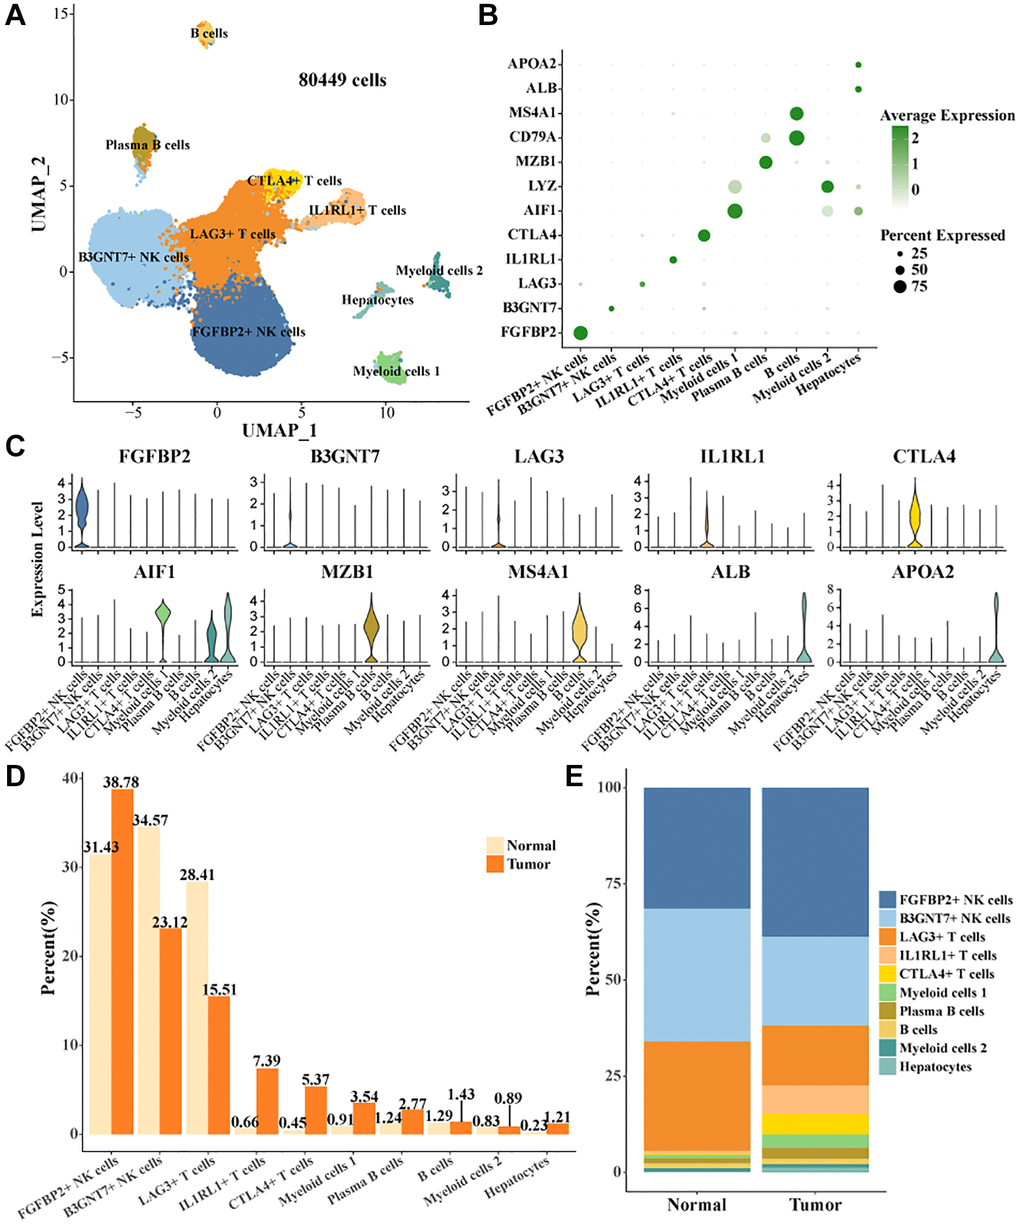
Figure 1.Cell landscape of TIICs in HCC. (A) Distribution of 10 cell types. (B) Bubble plots demonstrate the expression levels of marker genes in 10 cell types. (C) Violin plot of marker genes expression levels in 10 cell types. (D, E) Proportion statistics of 10 cell types in tumor tissues and normal tissues.