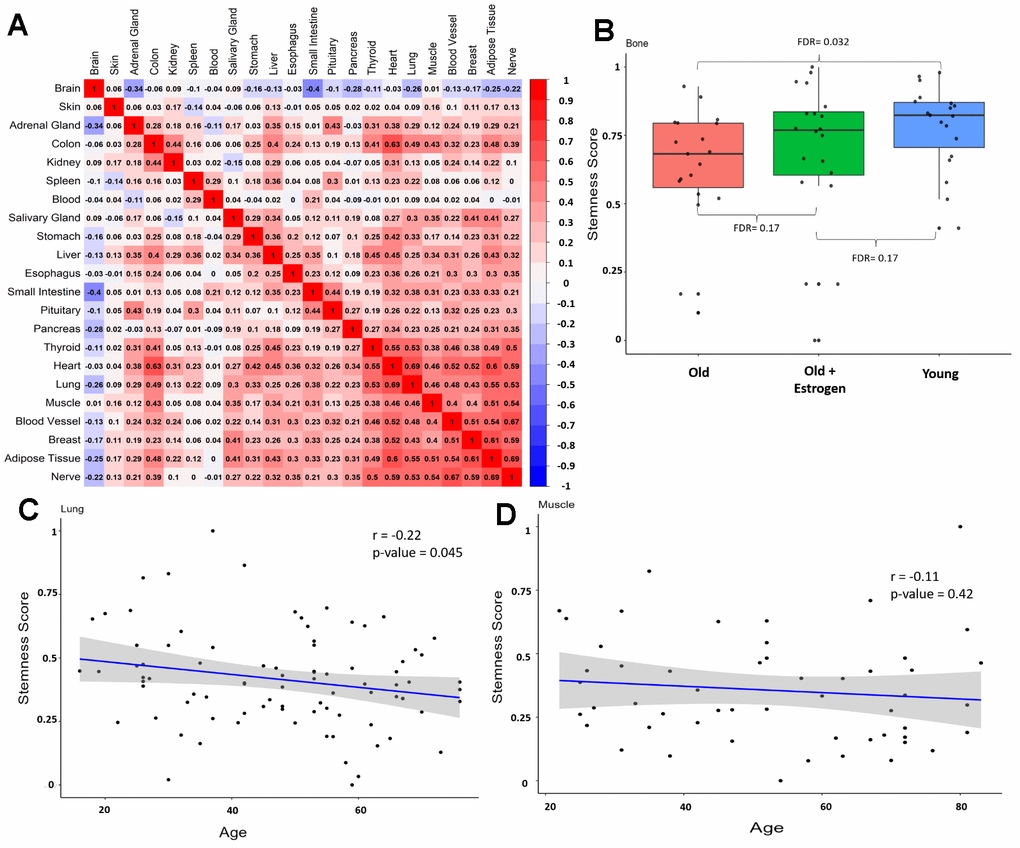
Figure 2.Stemness in same individual and validation datasets. (A) Correlation matrix between stemness across tissues from the same individual (excluding sex-related tissues) from GTEx. Numbers in each square represent the Pearson correlation coefficient. (B) Stemness levels of different groups in the alternative bone dataset, data from Weivoda et al. [30]. (C) Correlation between stemness and aging in an alternative lung dataset (r = -0.22, p-value = 0.045), data from Lee et al. [31]. (D) Correlation between stemness and aging in an alternative muscle dataset (r = -0.11, p-value = 0.42), data from Tumasian et al. [32].