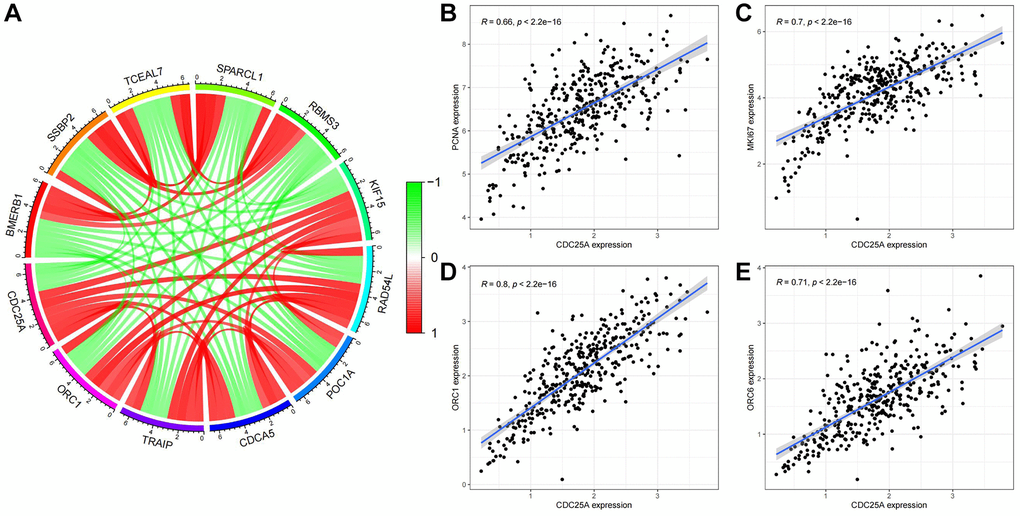
Figure 14.Co-expression analysis of CDC25A in gastric cancer. (A) Co-expressed genes of CDC25A. (B) Co-expression relationship between PCNA and CDC25A. (C) Co-expression relationship between MKI67 and CDC25A. (D) Co-expression relationship between ORC1 and CDC25A. (E) Co-expression relationship between ORC6 and CDC25A.