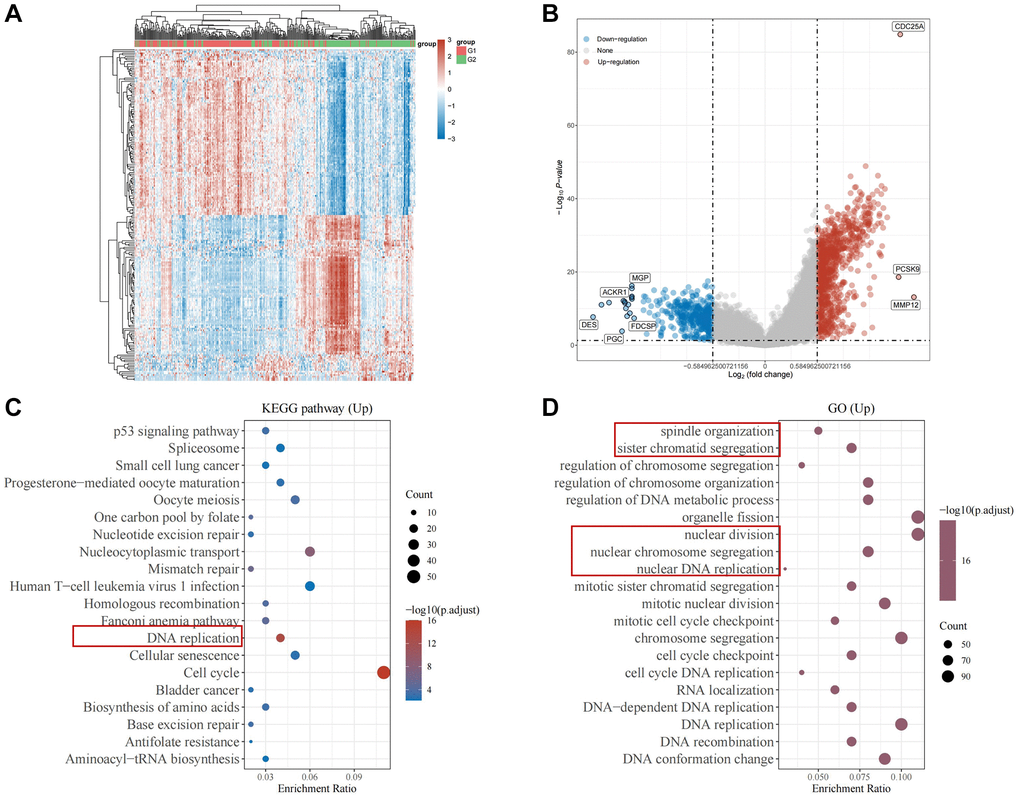
Figure 13.Enrichment analysis of CDC25A in gastric cancer. (A) Heat map of differential genes in the CDC25A high and low expression groups. (B) Differential gene volcano map of CDC25A high and low expression groups. (C) KEGG enrichment analysis of CDC25A. (D) GO enrichment analysis of CDC25A.