Submit an Article
Navigate
Home
Editorial Board
Editorial Policies
Current Volume
Archive
Scientific Integrity
Publication Ethics Statements
Interviews with Outstanding Authors
Newsroom
Sponsored Conferences
Podcast
Contact
Special Collections
Submit an Article
Online ISSN: 1945-4589
Research Paper
|
Volume 16, Issue 7
|
pp. 6445–6454
Risk assessment of extra-uterine involvement and prognosis in young type I endometrial carcinoma with high or moderate differentiation and less than 1/2 myometrial invasion
Back to article
Figure 1
−
100%
+
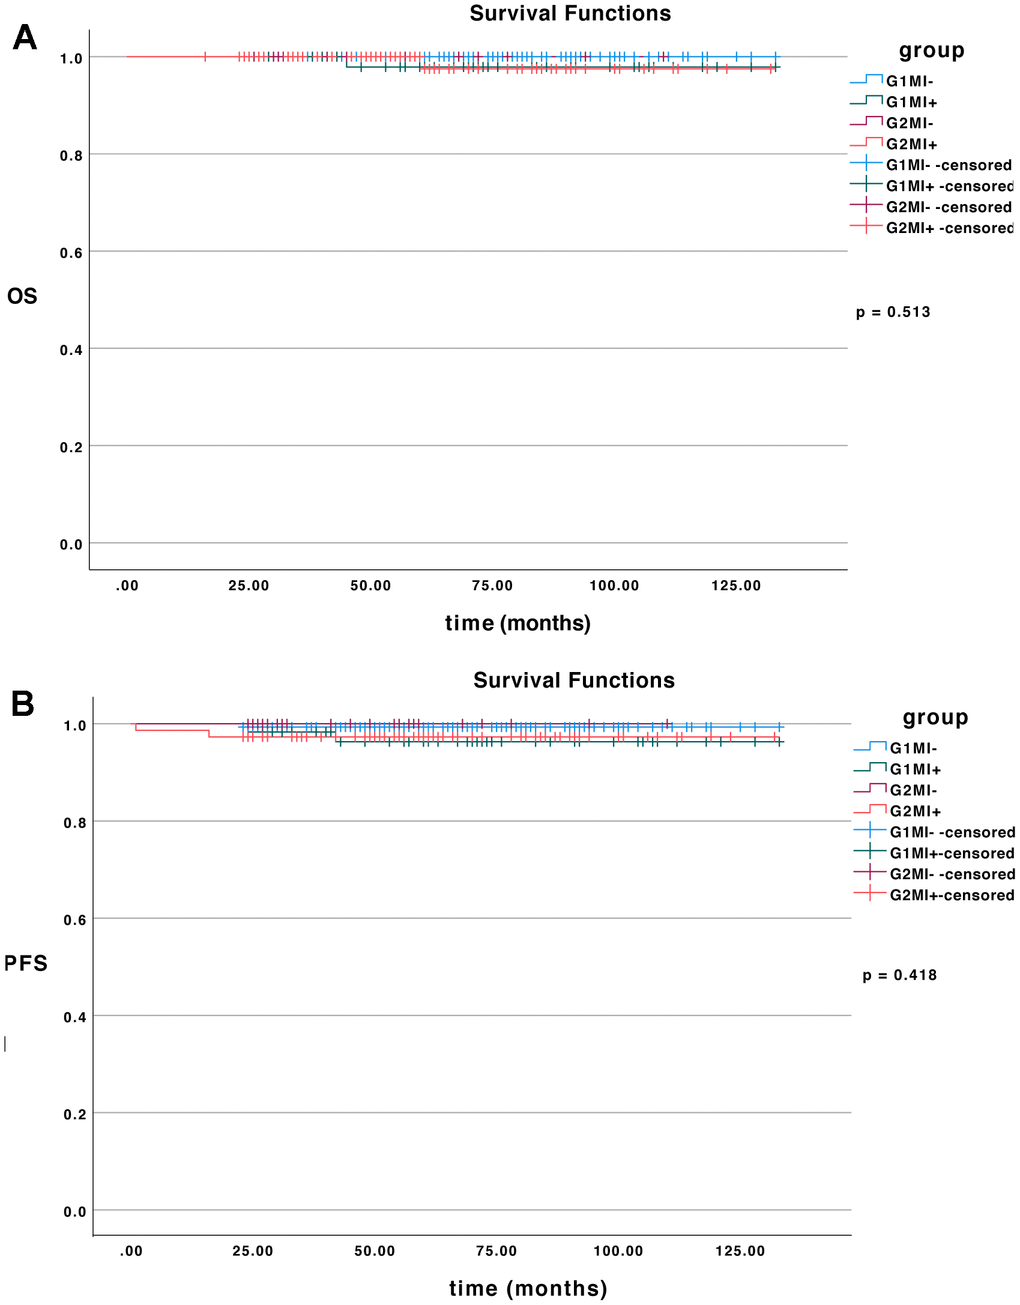
Figure 1.
The survival curves.
(
A
) OS of all patients in different subgroups (
p
= 0.513). (
B
) PFS of all patients in different subgroups (
p
= 0.418).