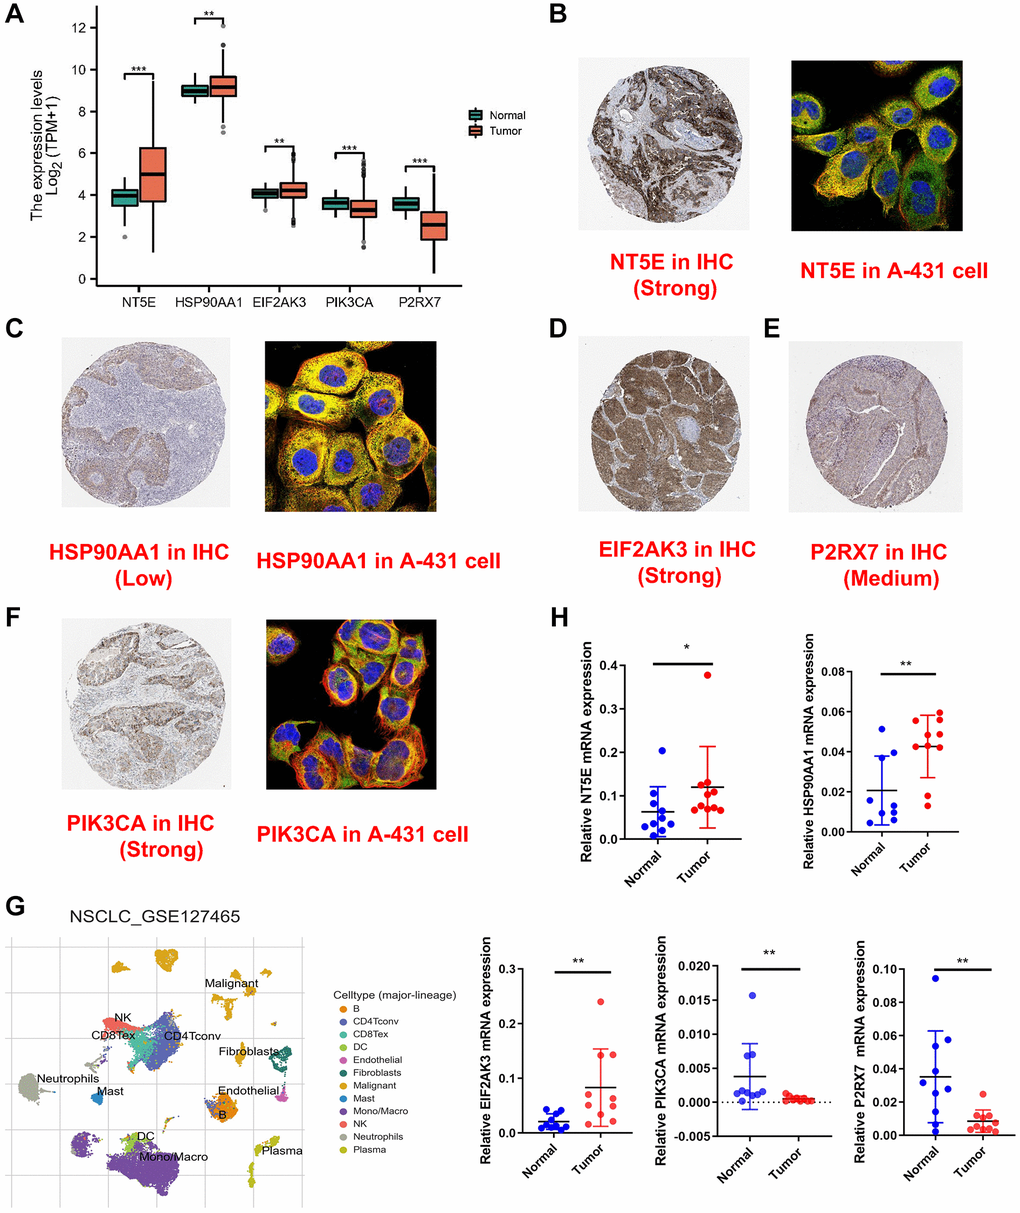
Figure 8.Validation of expression of genes involved in signature. (A) The expression of the five-signature genes in TCGA database. (B–F) The cell sublocalization immunofluorescence plot and IHC plot of five-signature genes. (G) Graph showing cell clusters identified by using single-cell RNA-seq dataset GSE127465. (H) The expression levels of five ICDGs in 10 paired LUAD and matched adjacent normal tissues were examined by qRT-PCR. *p < 0.05, **p < 0.01, ***p < 0.001.