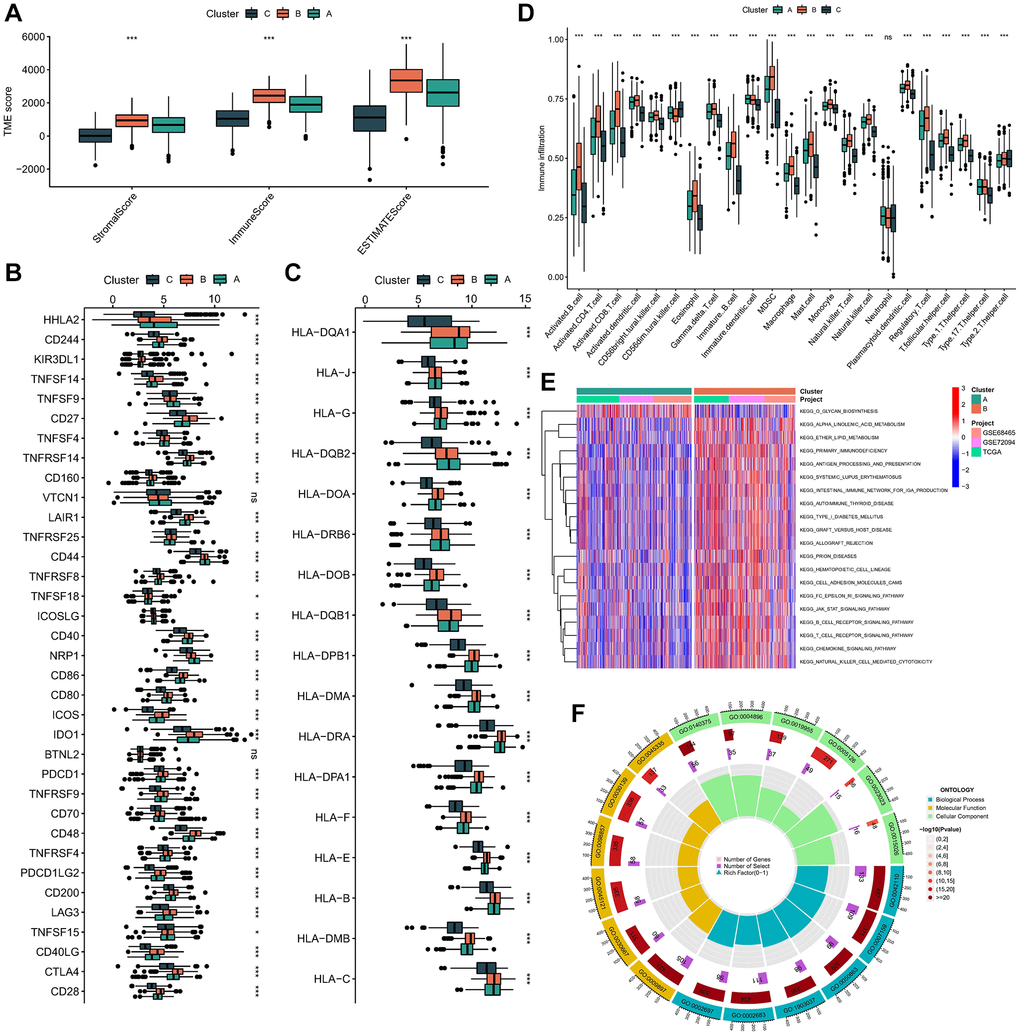
Figure 3.Immune microenvironment and functional enrichment analysis in molecular subtypes. (A) The difference in stromal score, ESTIMATE score, and immune score between different molecular subtypes. (B) Expression of immune checkpoints between different molecular subtypes. (C) Expression level of HLA genes between different molecular subtypes. (D) The infiltration of immune cells in TME in 3 subtypes. (E) The GSVA pathway enrichment analysis between different subtypes. (F) GO enrichment analysis results of 1033 DEGs. ns not significant, *p < 0.05, **p < 0.01, ***p < 0.001.