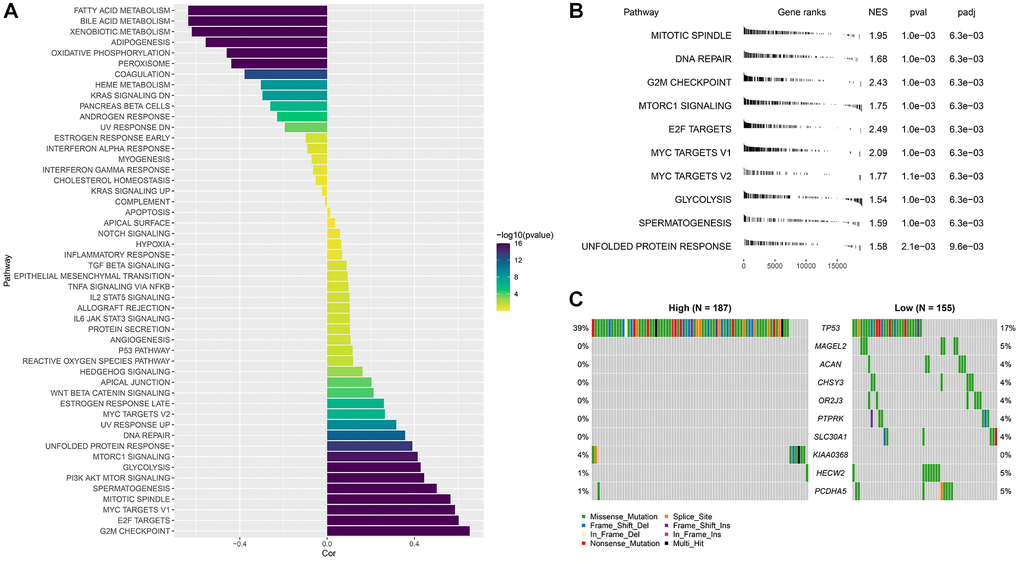
Figure 7.Abnormal biological pathways and gene mutations between different RiskScore groups. (A) Correlation between RiskScore and HALLMARK pathway score; (B) GSEA analysis between RiskScore groups; (C) Waterfall map of mutant gene differences between different RiskScore groups.