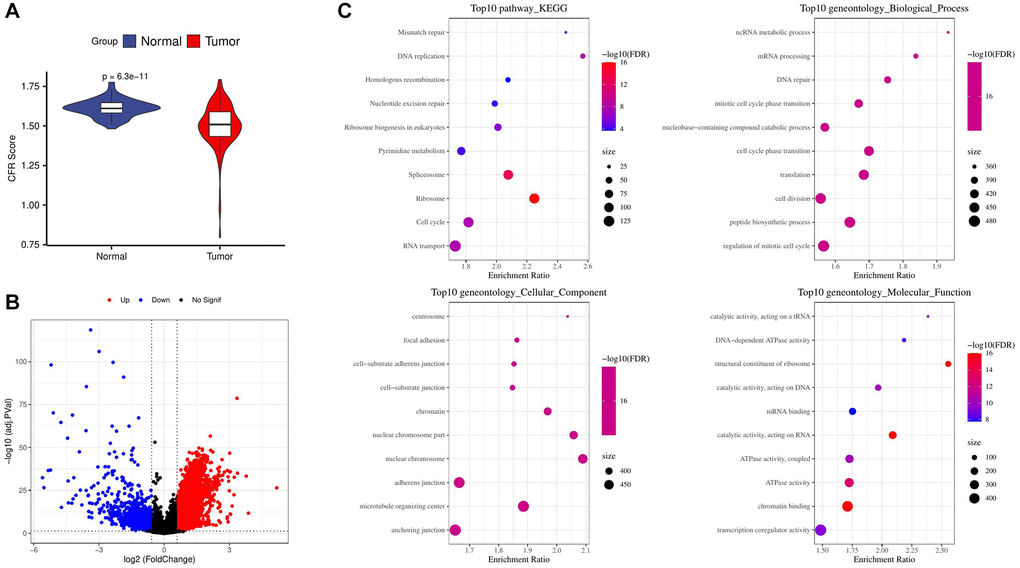
Figure 1.Screening and enrichment of DEGs. (A) Difference in CFR score between tumor and normal control samples in the TCGA cohort; (B) Volcano plot for screening differential expressed genes in the TCGA cohort; (C) Enrichment of tumor up-regulated genes by GO and KEGG analysis.