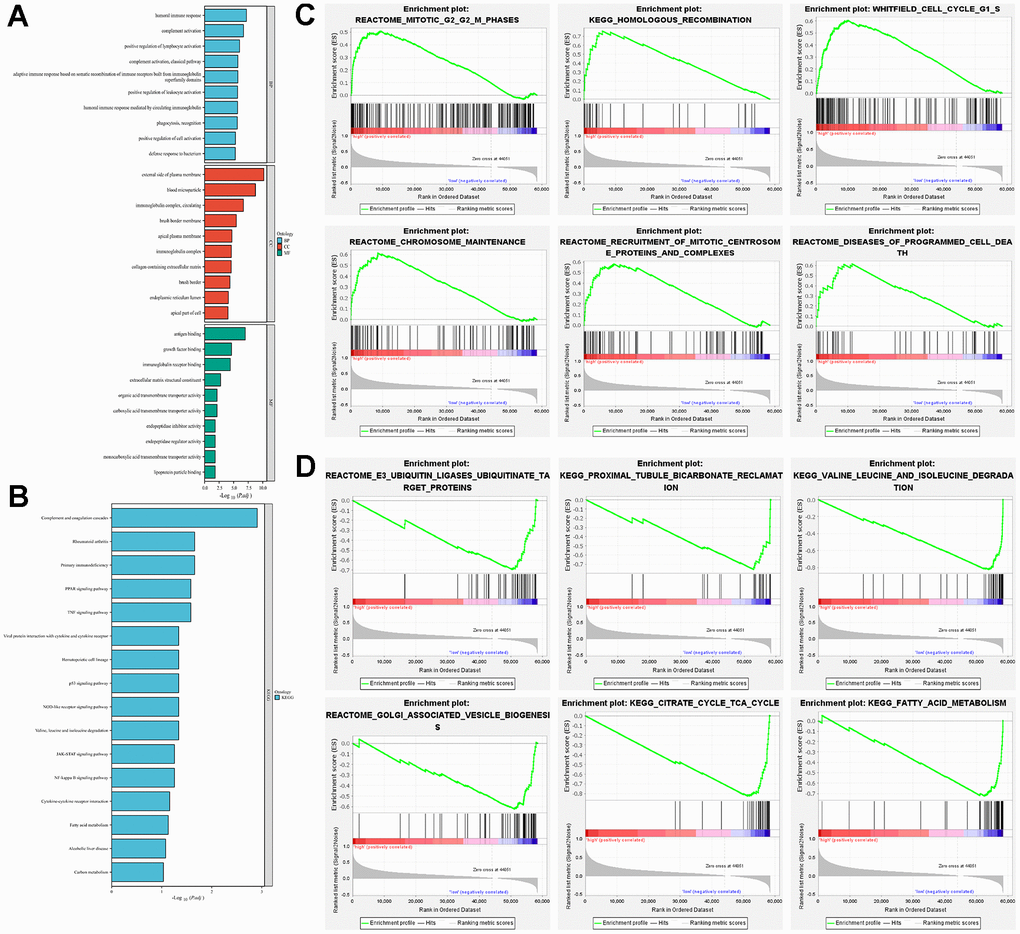
Figure 5.Exploration of potential function in high-risk and low-risk groups. (A) GO analysis explored the potential function in terms of BP, CC, and MF; (B) KEGG analysed the potential pathway enrichment; (C) GSEA analysed the potential pathway enrichment in the high-risk group; (D) GSEA analysis demonstrated the potential pathway enrichment in the low-risk group.