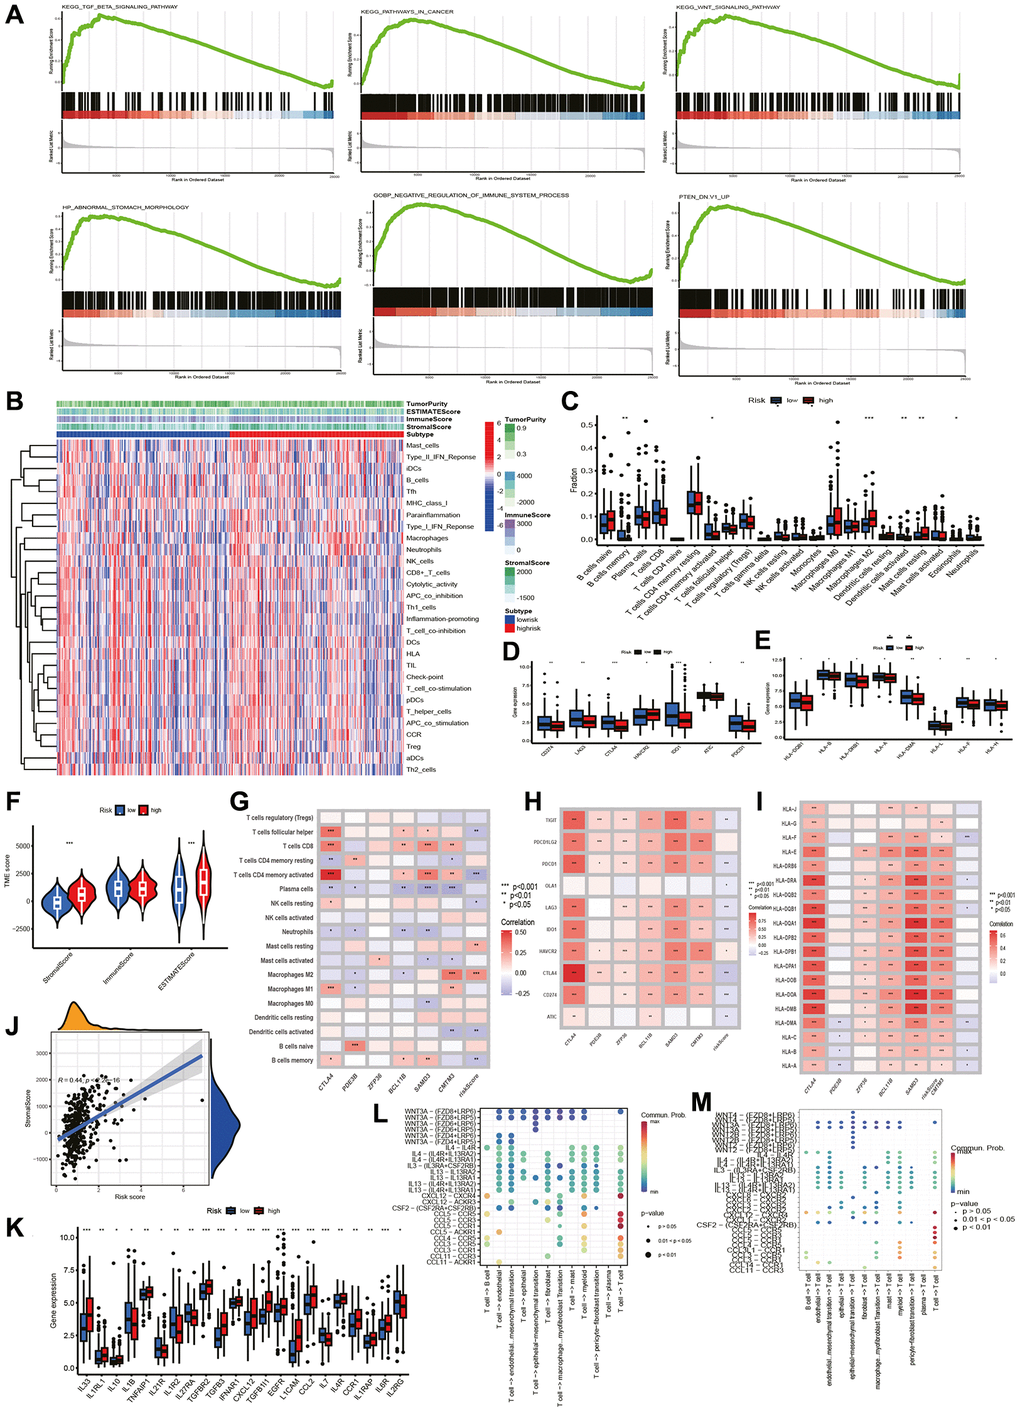
Figure 4.GSEA and TME analysis. GSEA and TME analysis. (A) Gene set enrichment analysis. (B) Heatmap shows risk and immune-related functions relationship. Differential expression of (C) 22 immune-associated cells, (D) immune checkpoint-associated genes, (E) HLA-associated genes, (F) stromal, immune and ESTIMATE scores, and (K) cytokine-related genes in two groups. Correlation of riskscore with (G) immune cells, (H) checkpoint-related genes, (I) HLA-related genes, (J) stromal score. (L) T cells initiate cytokine signal exchange between cells. (M) T cells receive cytokine signals to terminate intercellular signal communication.