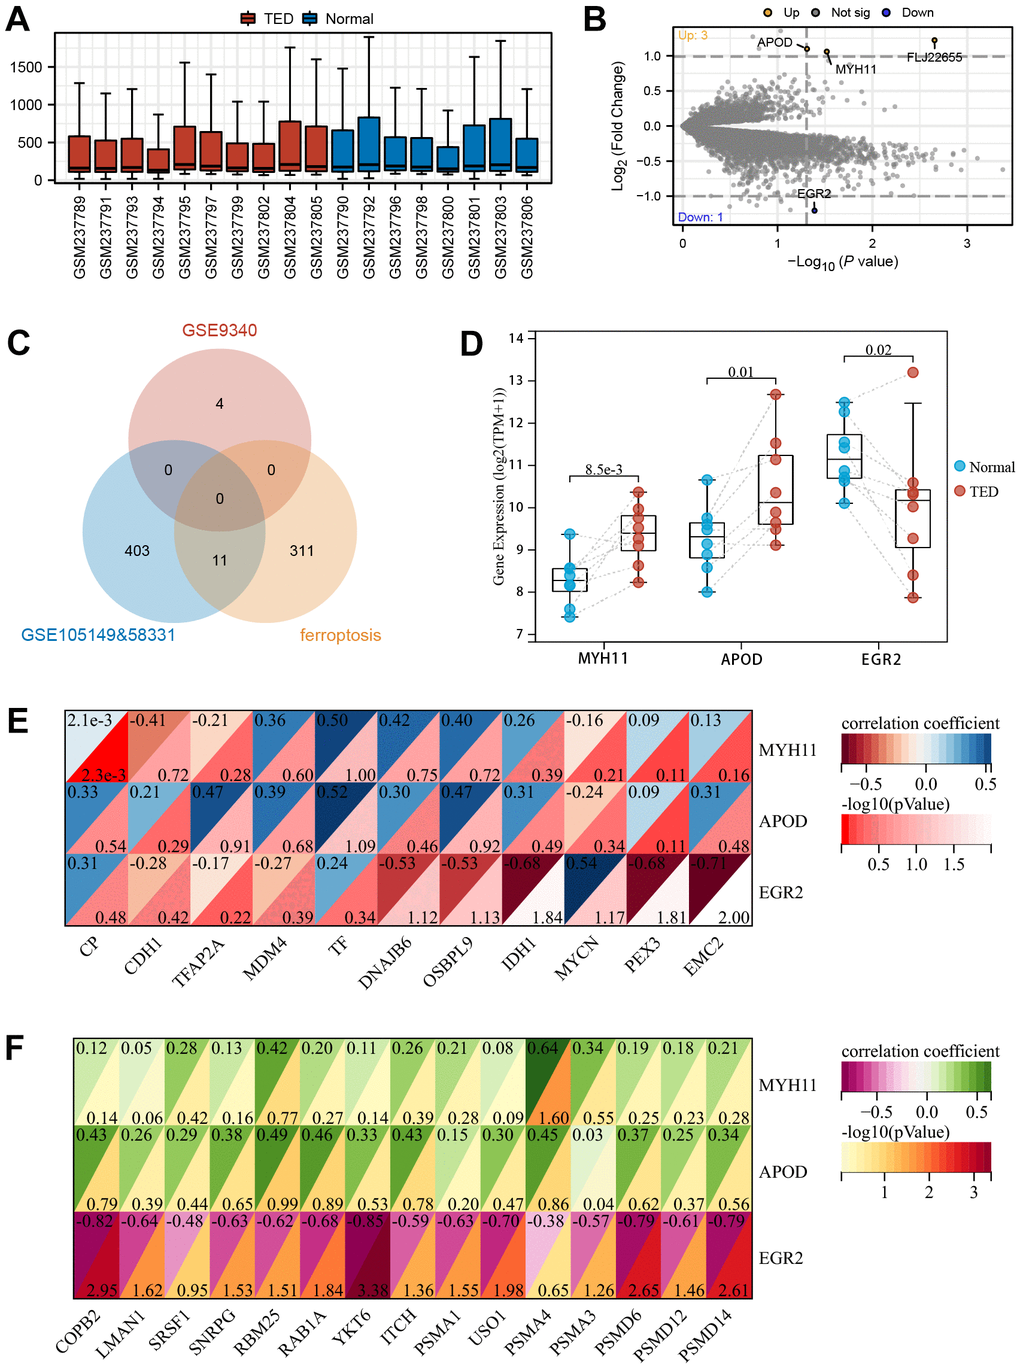
Figure 10.Screening of DEGs in thyroid. (A) Box plot of gene expression in TED-related datasets; (B) Screening of DEGs in thyroid samples; (C) Venn diagram of interaction among TED-related datasets and ferroptosis-related genes; (D) DEG expression levels between TED and normal groups; (E) Correlation analysis between DEGs in thyroid and F-DEGs; (F) Correlation analysis between DEGs in thyroid and hub genes. *P < 0.05, **P < 0.01, ***P < 0.001.