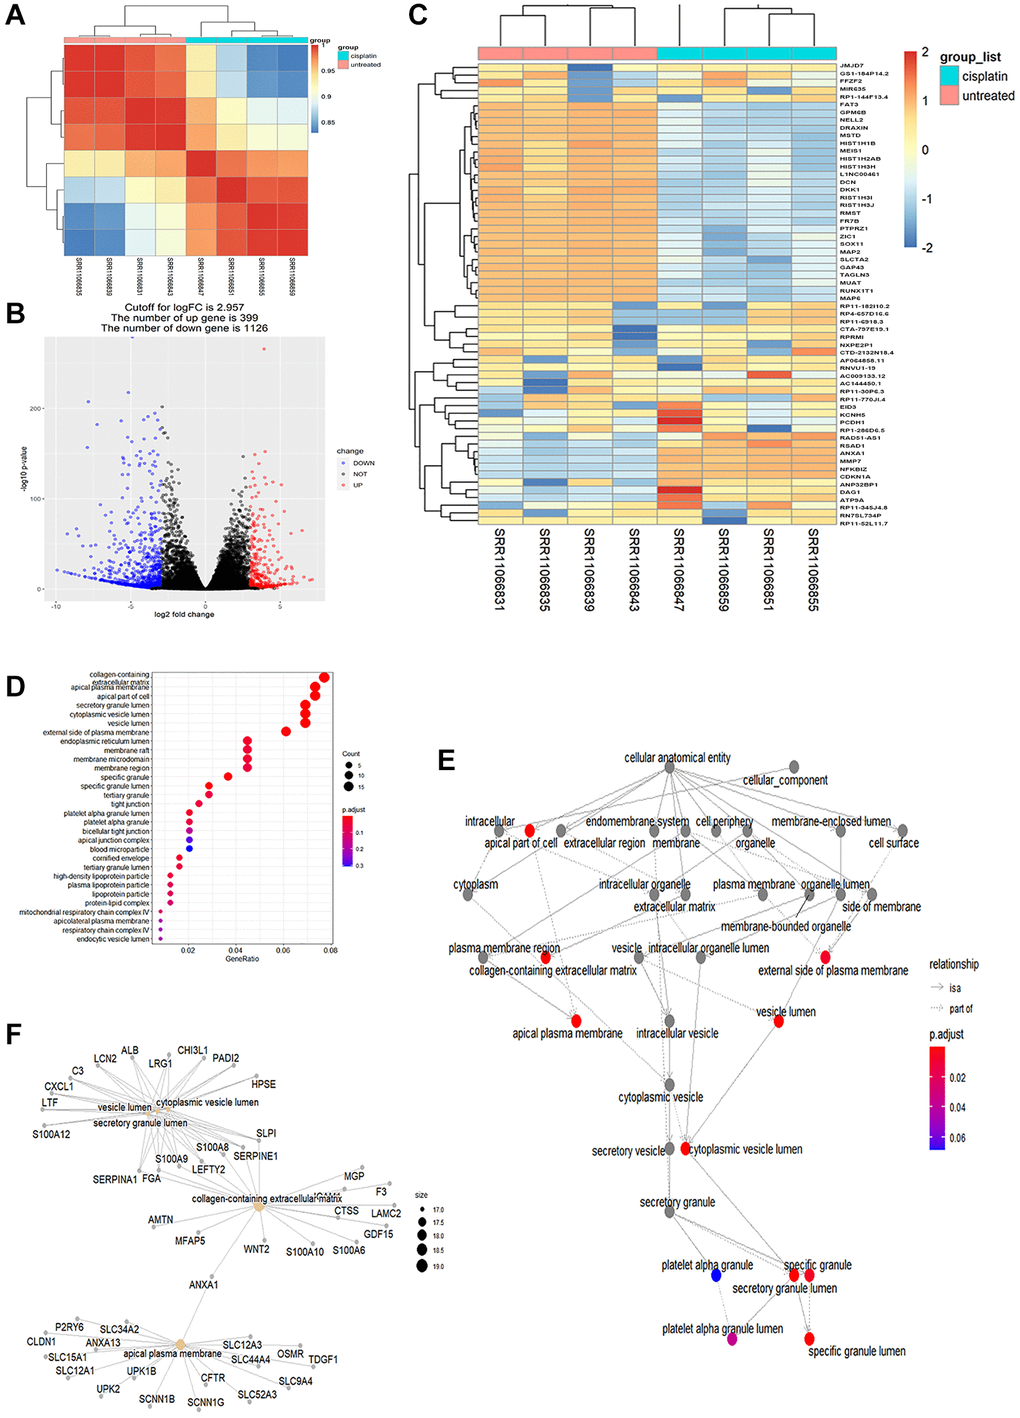
Figure 2.Differential transcriptome analysis of AKI samples. (A) Correlation of heatplot of differences between groups: a significant difference was observed between cisplatin and untreated groups in all the differently expressed genes (P < 0.05). (B) Differential gene volcano plot: 399 differentially expressed genes were up-regulated and 1126 differentially expressed genes were downregulated. The cutoff for logFC is 2.957. (C) Heatplot of the top 30 up-regulated genes and the top 30 downregulated genes. (D) Top 30 GO enriched analysis results in the dotplot (P < 0.05). (E) Correlation of the GO enriched analysis results in the goplot (P < 0.05). (F) Correlation of differently expressed genes in the GO enriched analysis in the cnetplot.