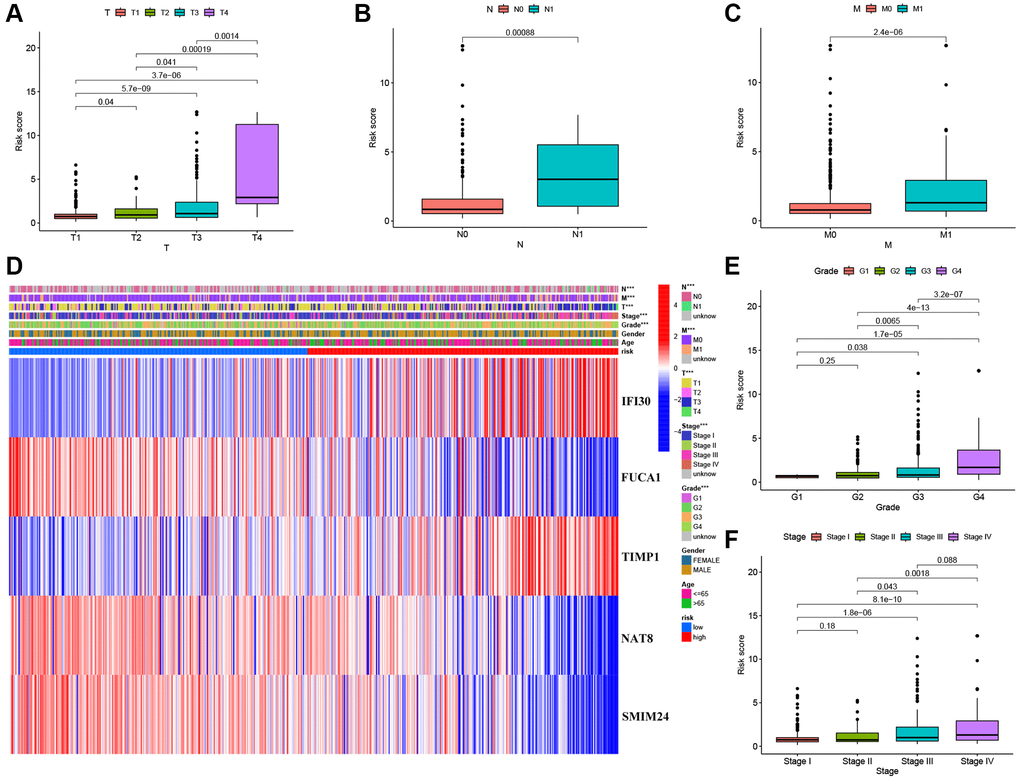
Figure 4.Correlation between risk scores and clinical characteristics. (A–C) Boxplot of risk scores based on MMGs signature for KIRC patients with different T status, N status, and M status. (D) Heatmap showed the relationship between clinical characteristics and expression of MMGs in the two risk groups. (E) Boxplot of risk scores based on MMGs signature for KIRC patients with different pathological grades. (F) Boxplot of risk scores based on MMGs signature for KIRC patients with different tumor stages.