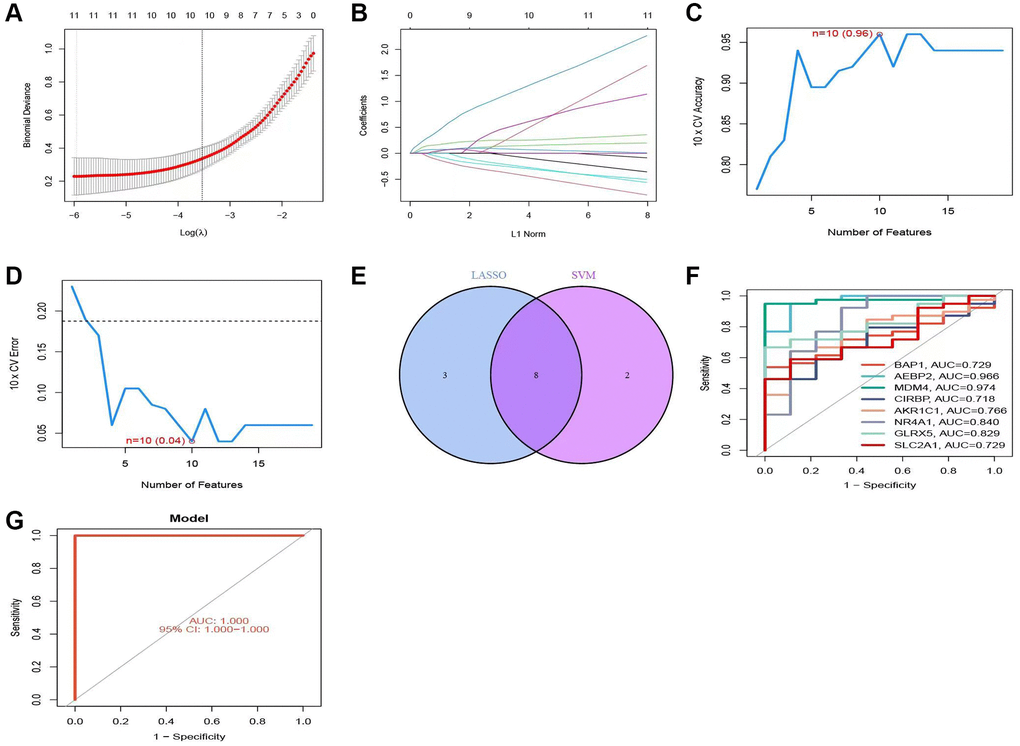
Figure 3.Construction of the prediction model. (A, B) Trajectories and distributions of each independent variable for lambda. (C, D) Reverse cumulative distribution of absolute residual for the SVM model. (E) Intersection of two model genes. (F) ROC curve showing the prediction results of the model genes. (G) Accuracy of the SVM model demonstrated by the ROC curves.