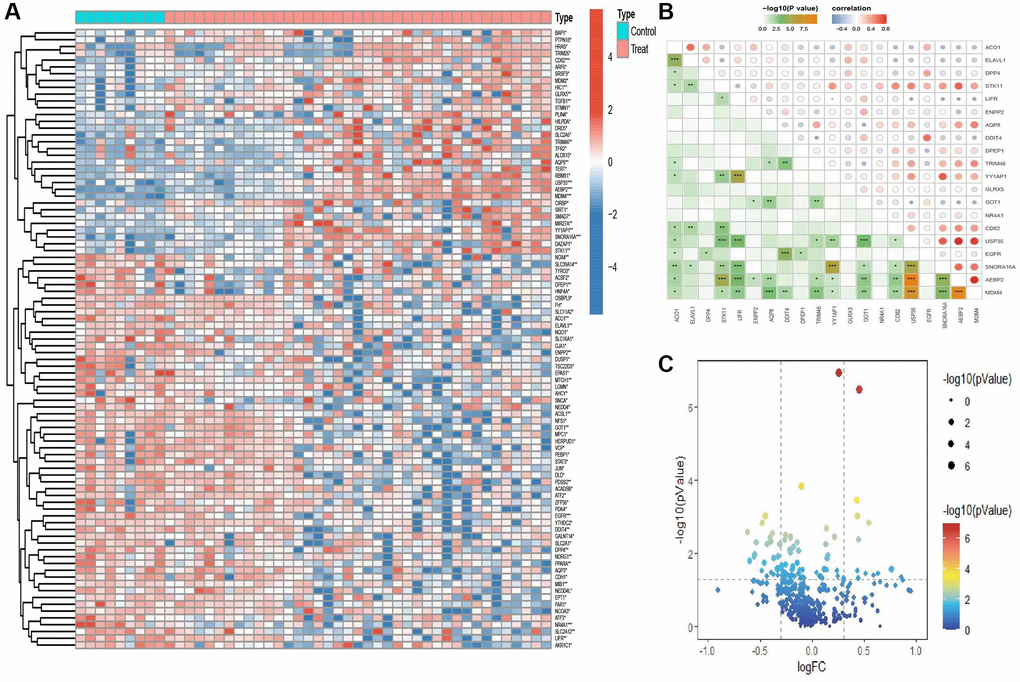
Figure 2.Analysis of genetic variations associated with iron-related mortality. (A) Heatmap shows distribution of gene differences related to iron-related mortality between the control group and the disease group. (B) Analysis of differential gene correlations. (C) The volcano map depiction of differential gene expression in ferroptosis.