Submit an Article
Navigate
Home
Editorial Board
Editorial Policies
Current Volume
Archive
Scientific Integrity
Publication Ethics Statements
Interviews with Outstanding Authors
Newsroom
Sponsored Conferences
Podcast
Contact
Special Collections
Submit an Article
Online ISSN: 1945-4589
Research Paper
|
Volume 16, Issue 6
|
pp. 5471–5500
Integrated single-cell sequencing, spatial transcriptome sequencing and bulk RNA sequencing highlights the molecular characteristics of parthanatos in gastric cancer
Back to article
Figure 8
(8 of 9)
−
100%
+
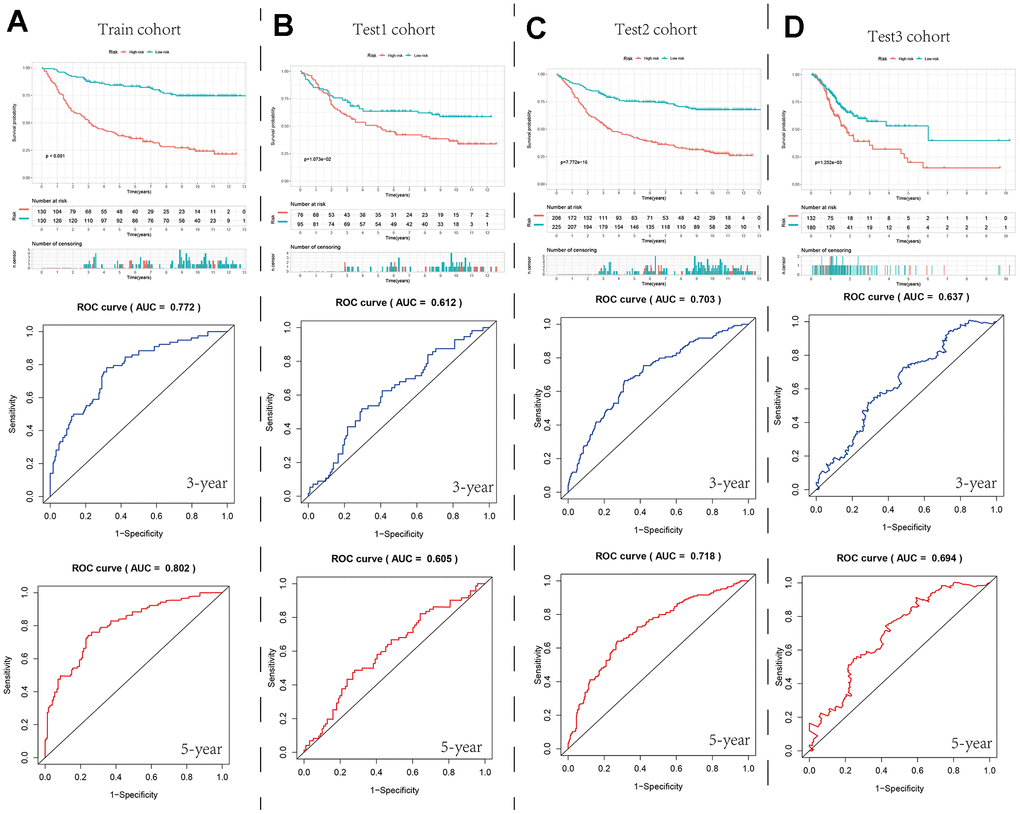
Figure 8.
Survival curves and ROC curves for the high- and low-risk groups in the four cohorts.
(
A
–
D
) Comparison of survival curve and ROC curve between train cohort, test1 cohort, test2 cohort and test3 cohort.